


Grade Level: 6-8,
9-12
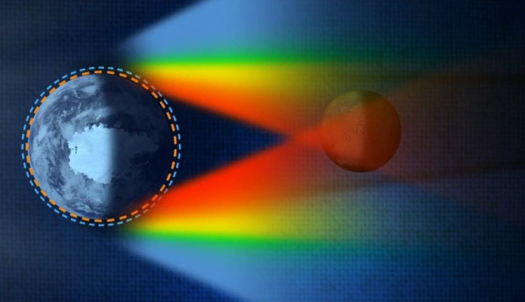
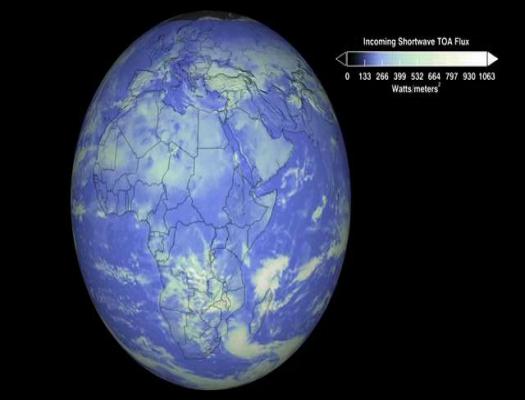
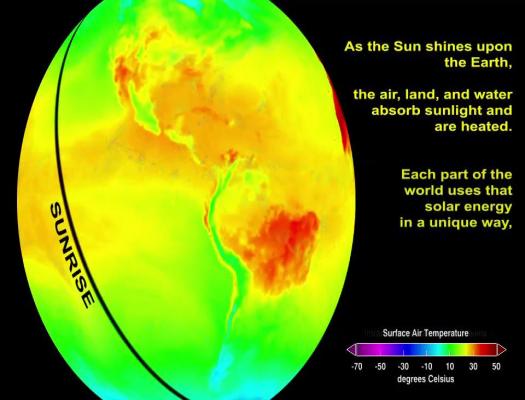
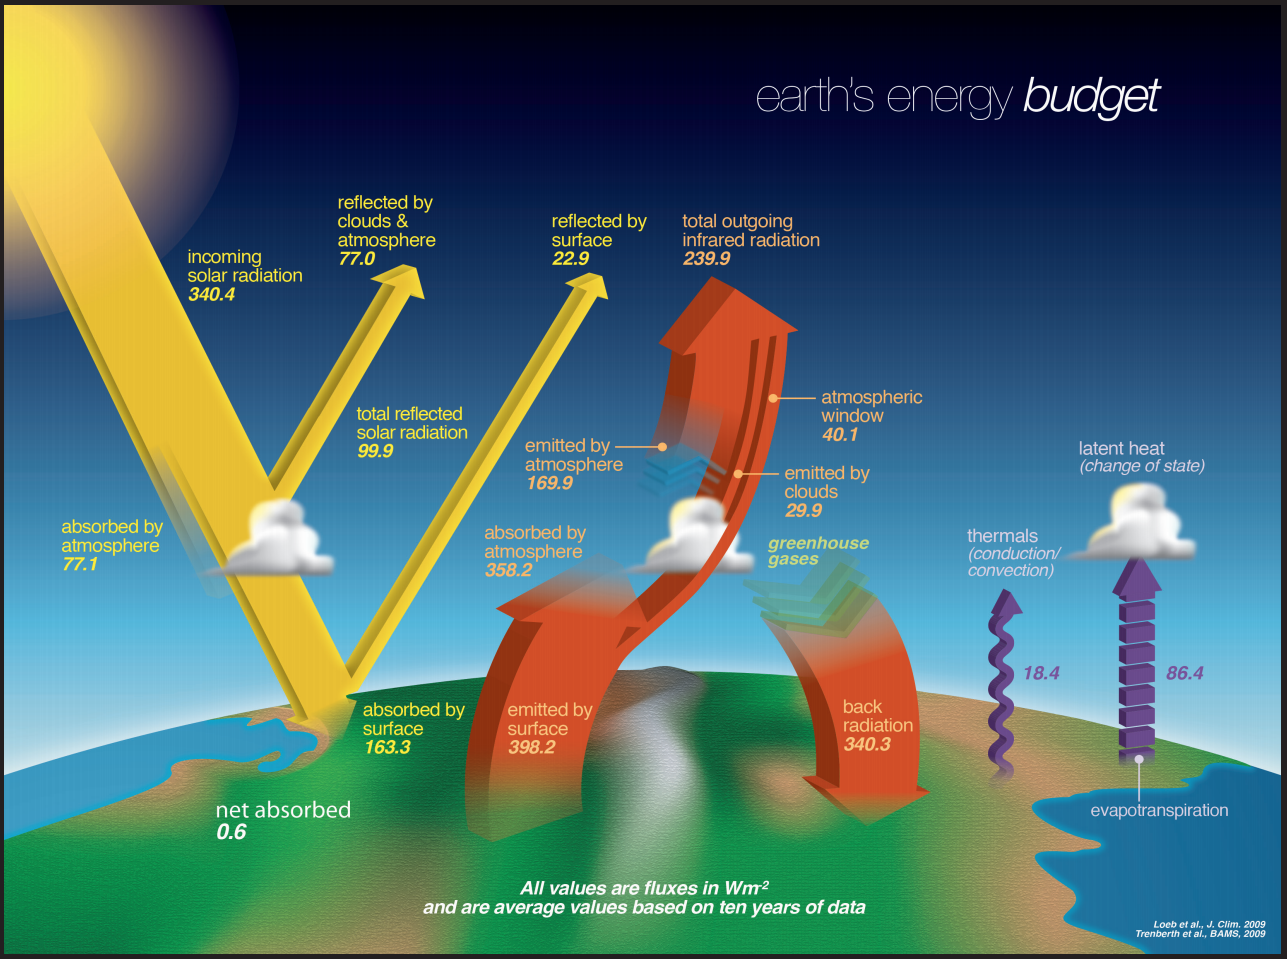
This mini lesson focuses on Earth's Energy Budget and the surface effects that occur in Central Australia. Students review a line graph depicting net radiation in Central Australia related to a multiyear drought from 2002 - 2009 and answer the questions.