Mini Lesson/Activity
Carbon Dioxide Production and Sequestration
Overview
Students will evaluate a Landsat image to determine the rate of carbon dioxide sequestration in a particular area.
Student Directions
Background
Carbon dioxide concentration in the atmosphere depends upon different processes. This includes processes that produce carbon dioxide and processes that remove it. Removing carbon dioxide and storing it is called sequestration.
Examples of processes that add carbon dioxide into the atmosphere include:
- fossil fuel combustion
- human respiration
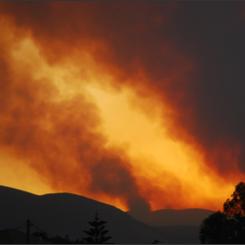
- forest fires
Examples of processes that remove (or sequester) carbon dioxide from the atmosphere include:
- dead leaf burial
- plant respiration
NASA Visualization Explorer: NASA's Goddard Space Flight Center, OCO-2 satellite and satellite data images courtesy of NASA/JPL
https://mynasadata.larc.nasa.gov/sites/default/files/inline-images/Production%20and%20Sequestration%20Image%20with%20grid.png
Steps
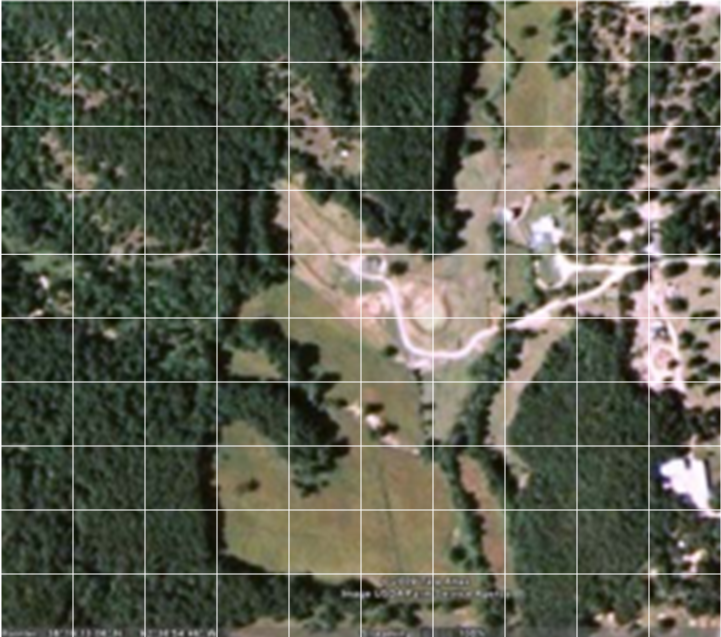
- Use the image of forested and deforested land to answer the questions. Check with your instructor on how to submit answers.
- The picture shows a plot of landscape measuring 1 kilometer on a side.
- Each box on the image covers 2.5 acres.
- The land and soil with green trees sequester carbon dioxide at a rate of 1 ton per acre per year. So, a box that is all trees will sequester 2.5 tons of carbon dioxide per year.
- The deforested land and soil have smaller amounts of vegetation and only sequesters carbon dioxide at a rate of 0.2 tons per acre per year. So, a box that is all deforested, or bare, land will sequester 0.5 tons of carbon dioxide per year.
- Estimate the size of the forested (dark green) area of the picture in acres. If one box has more than one type of cover, estimate how much is trees and how much is not. How many forested acres are in this picture?
- Estimate the size of the deforested, bare area of the picture. How many deforested acres are in this picture?
- How much carbon dioxide is sequestered by trees?
- (Number of boxes covered by trees X 2.5 tons of carbon dioxide per year)
- How much carbon dioxide is sequestered by bare land?
- (Number of boxes covered by bare land x 0.5 tons of carbon dioxide per year)
- What is the total rate of carbon dioxide sequestration in this particular area in terms of tons per year?
- A typical American home produces about 10 tons of carbon dioxide per year. The image shows one house. What is the is the overall (or net) sequestration of carbon dioxide in the image including the house?
- Assume someone built 50 more homes on the land in the image. What would the overall (or net) carbon dioxide sequestration be?
Sources:
- NASA Visualization Explorer: NASA's Goddard Space Flight Center, OCO-2 satellite and satellite data images courtesy of NASA/JPL
- Space Math: http://spacemath.gsfc.nasa.gov
Teacher Note
Teachers, these mini lessons/student activities are perfect "warm up" tasks that can be used as a hook, bell ringer, exit slip, etc. They take less than a class period to complete. Learn more on the "My NASA Data What are Mini Lessons?" page.
Teachers who are interested in receiving the answer key, please complete the Teacher Key Request and Verification Form. We verify that requestors are teachers prior to sending access to the answer keys as we’ve had many students try to pass as teachers to gain access.
Disciplinary Core Ideas:
- ESS3A: Natural Resources
- ESS3C: Human Impacts on Earth Systems
Crosscutting Concepts:
- Scale, Proportion, and Quantity
Science and Engineering Practices:
- Analyzing and Interpreting Data
- Using Mathematics and Computational Thinking