Data Literacy Cube Guide
What is the Data Literacy Cube?
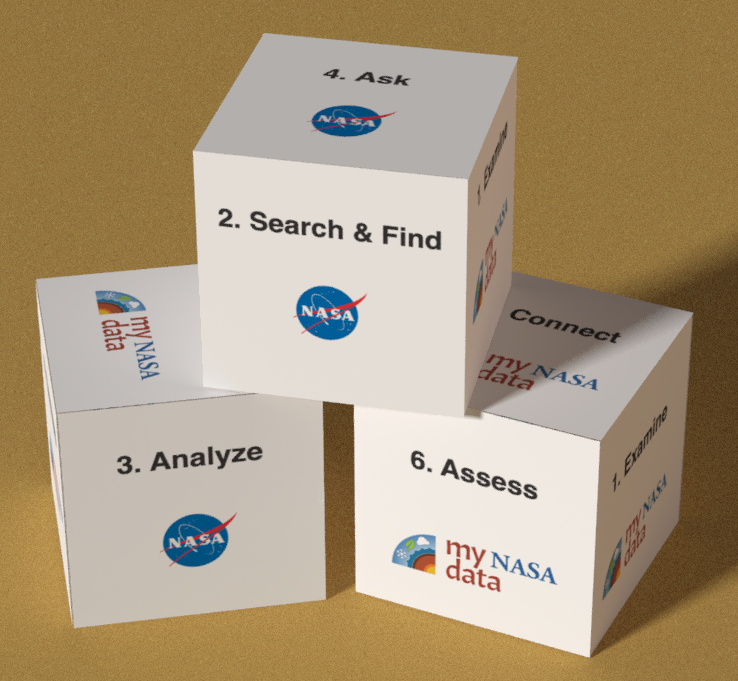
Educators, consider using the My NASA Data Literacy Cubes to guide students’ exploration of graphs, data tables, and mapped images of NASA Earth science data (or other sources of Earth data). Leveled question sheets provide opportunities for students to connect with data, regardless of language proficiency or academic skill. These tools were created with the Next Generation Science Standards in mind. They help students develop their Data Analysis and Interpretation skills, as well as help them to recognize patterns, cause & effect, stability & change, and more!
What's included in the Data Literacy Cube Guide?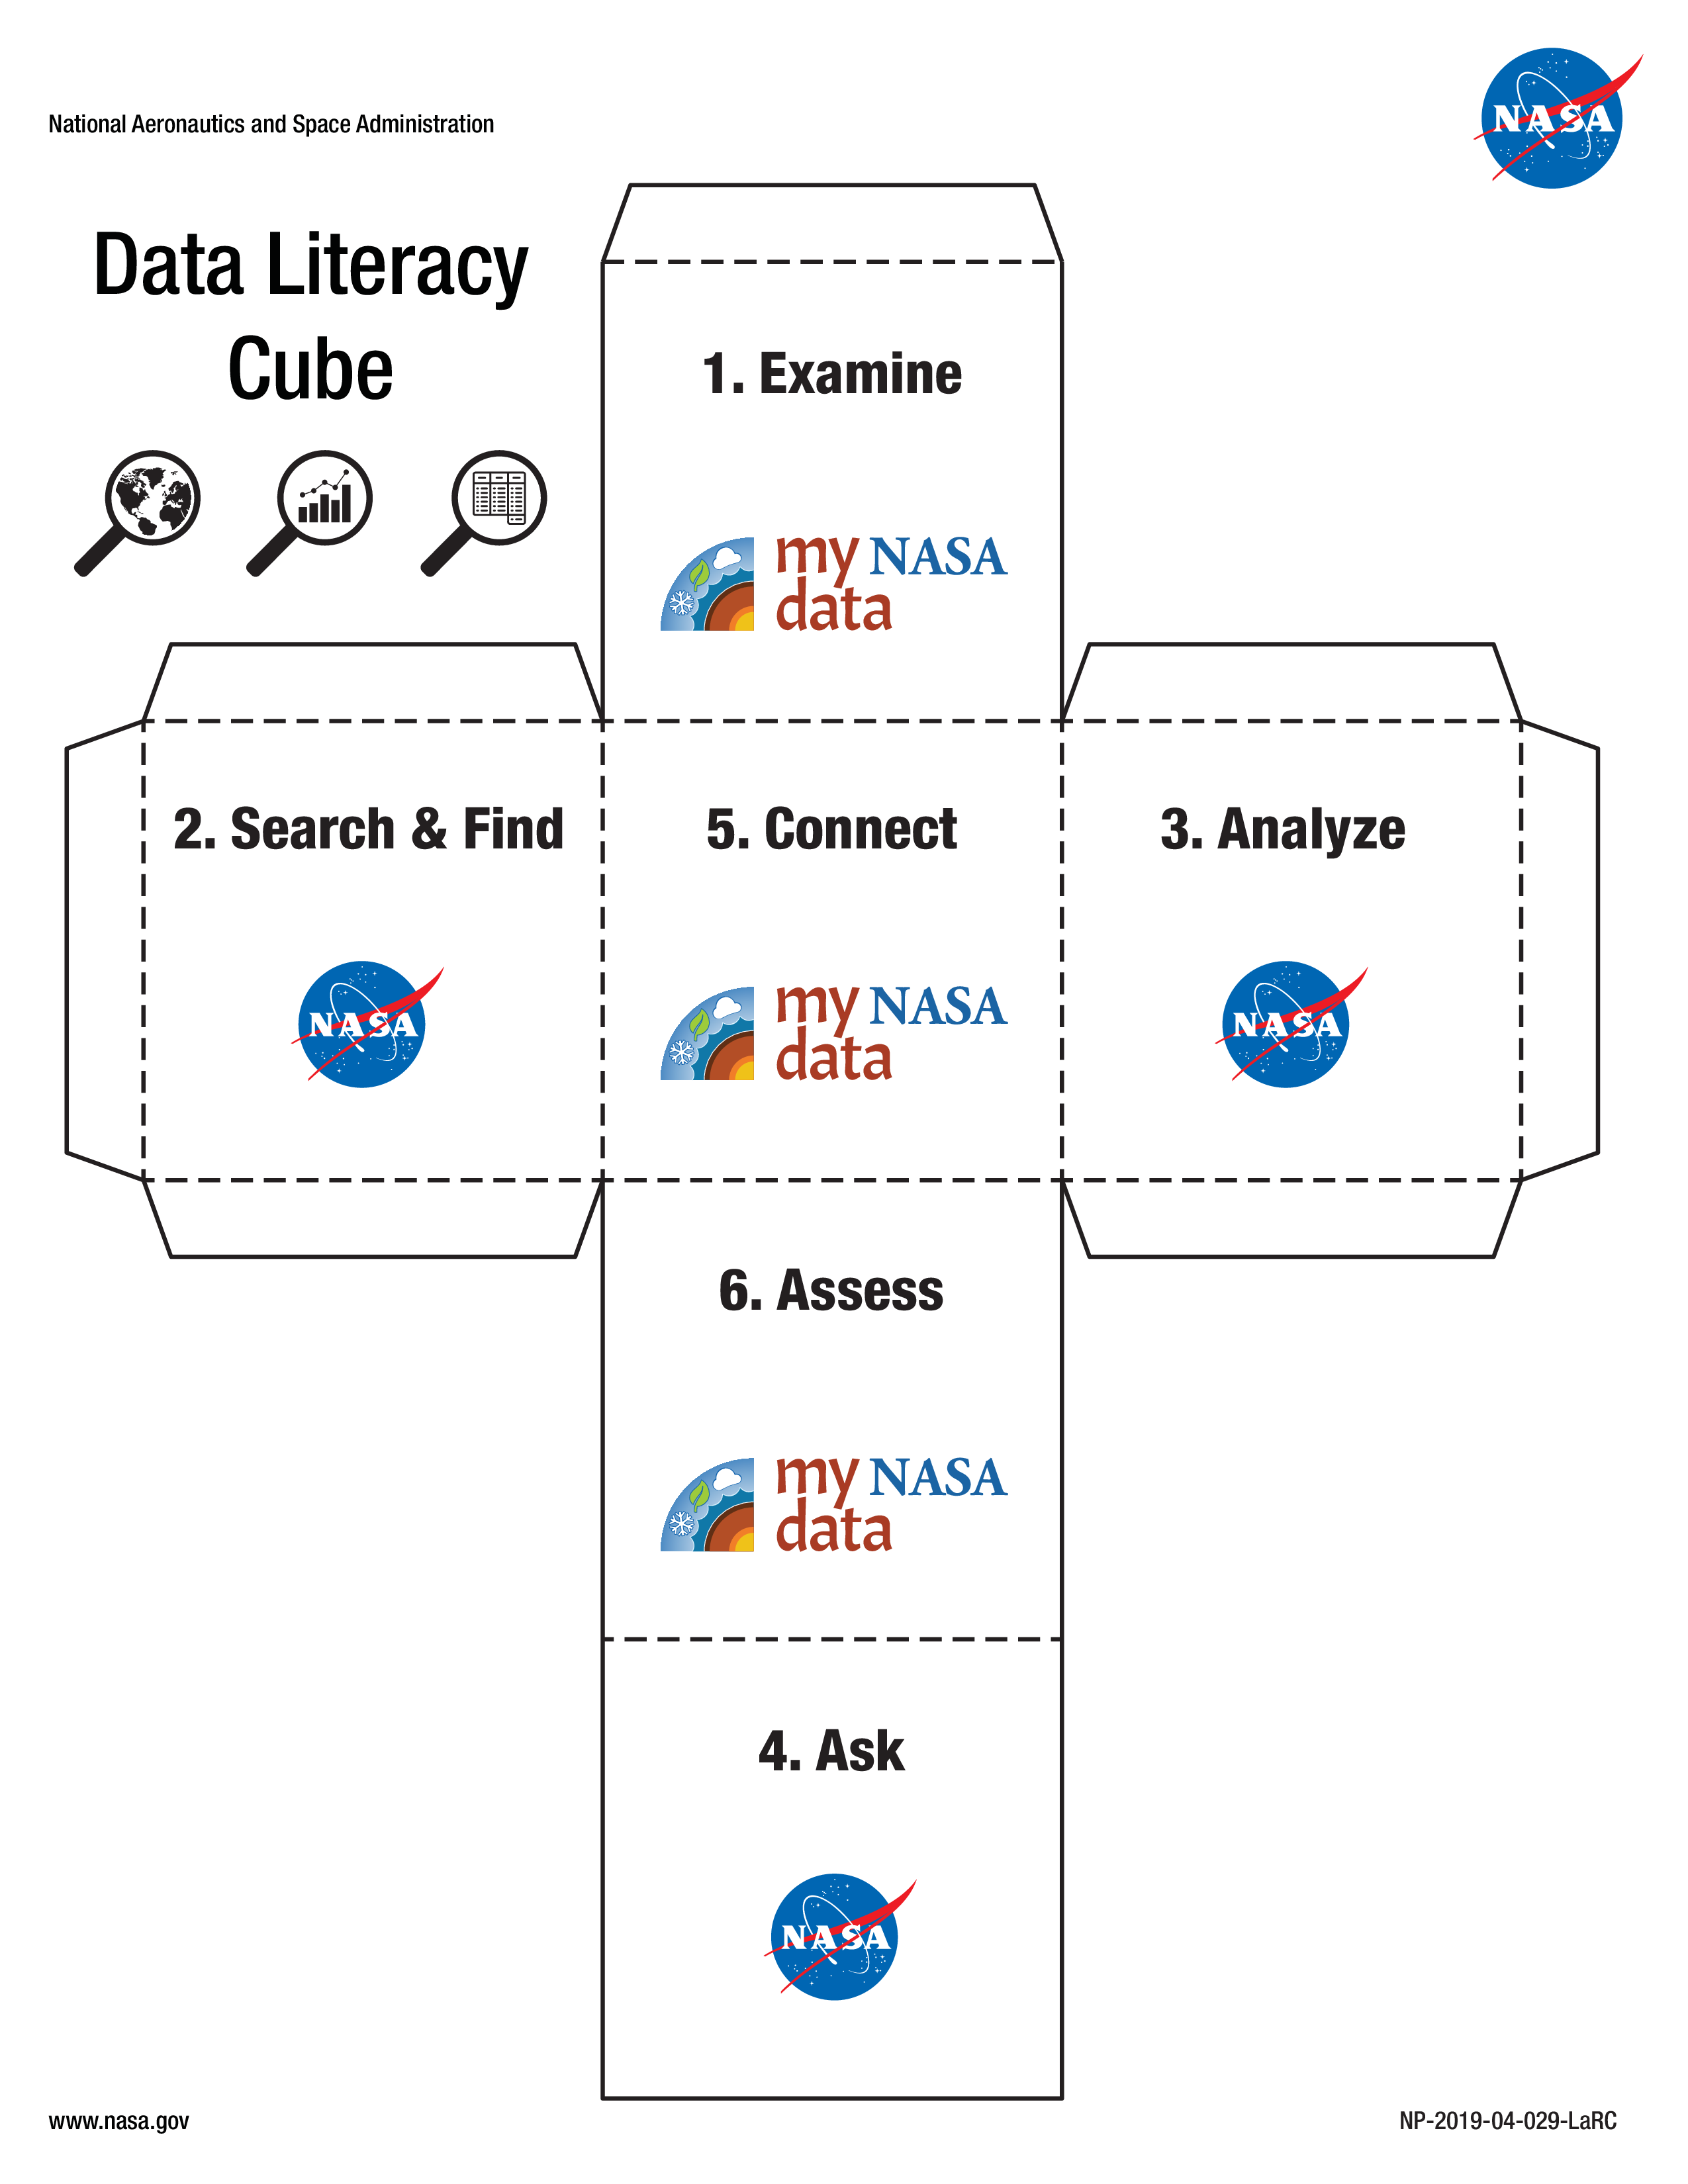
- Cube Template: Within this guide, you will find a black-line master template for one cube. (Unlike the earlier versions, this guide includes only one cube.) This template is intended to be constructed for use with the question sheets. Alternatively, gaming dice or virtual dice rollers may be substituted for the cube.
-
Question Sheets - This guide has three different sets of questions that educators may use with different types of data visualizations commonly used in Earth/environmental science classrooms: maps, graphs, and data tables. See their related icons below. Do you have your own set of maps, line charts, or data tables that you use with students? Do you pull charts and maps from the textbook for students to analyze? Do you have them create and analyze their own data visualizations? If your answer was "yes" to any of these questions, try these question sets!

- Once you know what kinds of data you are working with, the next task is identifying the needs of your students. Are you working with elementary students? No problem! Working with AP Environmental students? No problem. Working with students anywhere in between? No problem!
- Each question set has four leveled question sheets to help you differentiate your instruction and each are leveled for both Lexile and English-language proficiencies. The sheets are provided in labeled and unlabeled versions for educators to use at their discretion. See the bottom right of the labeled question sheets for the designations of the levels.
- Novice (Lexile Levels - 200-400) (WIDA proficiency level suggestions: 1.5-2.5)
-Intended Audience: elementary students, struggling learners, ELL’s, and students with specific accommodations. - Developing (Lexile Levels - 210-400) (WIDA proficiency level suggestions: 1.9-2.5)
-Intended Audience: elementary students, struggling learners, ELL’s, and students with specific accommodations. - Proficient (Lexile Levels - 410-600) (WIDA proficiency level suggestions: 2.5-4.5)
-Intended Audience: students who require reading supports, and those whose sentence and word phrase dimensions are more advanced. - Advanced (Lexile Levels - 610-800) (WIDA proficiency level suggestions: 4.5-6)
-Intended Audience: fluent English speakers, academically advanced learners, and abstract thinkers.
- Novice (Lexile Levels - 200-400) (WIDA proficiency level suggestions: 1.5-2.5)
- Each question set has four leveled question sheets to help you differentiate your instruction and each are leveled for both Lexile and English-language proficiencies. The sheets are provided in labeled and unlabeled versions for educators to use at their discretion. See the bottom right of the labeled question sheets for the designations of the levels.
- Keyword List - A list of keywords is included on various question sheets. It provides the teacher and learner with opportunities to document key vocabulary words that are incorporated in the data analysis prior to starting the activity. Some words have been included in the list, but space is provided for those who wish to add additional words that are important in the lesson.
- Task Card - The Task Cards provide roles for students to perform while conducting the data analysis. This allows students to specialize in an area of data analysis and recording while contributing to the team. (This is a great way to also include multilingual and other learners.)
For videos on how to use the cubes go to the My NASA Data - Data Literacy Cubes Tutorials YouTube Playlist.
For more differentiation strategies, see the Data Jigsaw Student Activity: Exploring Sea Level Rise with Others video from NASA STEM.
What advanced preparation is necessary from the educator?
- Access Earth science-related maps, graphs, and data for students to analyze. Identify lesson plans and activities that feature data resources in My NASA Data that students will analyze using the Data Literacy Cubes. You may want to print these for students to use. NOTE: These tools can be used with other Earth Science models and visualizations commonly found in textbooks, websites, etc.
- Visit My NASA Data to identify content related to Earth Science topics. This website provides activities, lesson plans, and a data visualization tool, the Earth SystemData Explorer. To access NASA data to use authentic Earth science data, visit the My NASA Data visualization tool, https://mynasadata.larc.nasa.gov/EarthSystemLAS/UI.vm/).
- Print the appropriate question sheets for the Earth science materials you plan to use with students.
- Print and prepare the Data Cube using the Cube Template for Students/Groups. (Note: You can also use gaming dice, virtual dice roller, etc. as a substitution.) Consider having students assemble their own cubes, individually or in teams, to foster a sense of ownership. If teams assembled the cubes, consider having the same teams use the cubes throughout the year and keeping the cubes in the classroom. You can also assign roles from the Task Cards. These roles can change throughout the year.
- Assign question sheets to individual students or groups based on academic levels. Monitor students’ progress over the year and assign new level question sheets as needed.
- Print Task Cards for each group and other resources as needed. See the Task Card Blackline Master in this resource.
How do I use the cube and question sheets with my students?
Goal: Students engage with data by rolling the cube (or die) and answering questions on the leveled Question Sheet to guide their data analysis.
- Distribute Earth Science maps, graphs, or data to students/groups, as well as cube or die.
- Distribute the appropriate leveled-question sheet to students/groups.
- Prior to beginning the data analysis, consider the following:
- Review the list of keywords and their meanings with students.
- Identify any additional keywords your students need to know and add them in the space provided.
- Use additional scaffolding strategies as needed. You may also wish to include strategies such as: draw pictures on the cube to show what each question is about, write words in their native language, jigsaw, Frayer Model, Round robin, fishbowl, think alouds, storyboards, etc.
- Assign the roles from the Task Card to the students in each group.
- Begin the data analysis by instructing students to roll the cube (or numbered die) to answer appropriate question/s. (Allow students to work in a small group setting while they roll the cube and respond to the questions).
- If additional writing space is required, have students use regular notebook paper (or word processing document) and attach it to the question sheets.
- Have each group share with another group or with the class after completing their question sheet.
- Monitor student progress and assign new level sets as students reuse cubes throughout the year.
How do I use these resources in a virtual learning environment?
Virtual Teachers: Each version of the data cube question sheets are available as a Google Form![]() . Follow the steps below to include these in your lessons.
. Follow the steps below to include these in your lessons.
- Make a copy of the Google Form of your choice so that you may assign it directly from your Google Drive into your Learning Management System (e.g., Google Classroom, Canvas, Schoology, etc.).
- Customize your form to fit the needs of the lesson. This will include uploading a copy or link to the data visualization you wish for students to analyze.
- Share the link with your students.
- Review this
 Guide to Using Google Forms with My NASA Data for more guidance on using Forms with your students.
Disciplinary Core Ideas:
- ESS2A: Earth Materials and Systems
Crosscutting Concepts:
- Patterns
- Cause and Effect
- Stability and Change
Science and Engineering Practices:
- Asking Questions and Defining Problems
- Analyzing and Interpreting Data
Related Lesson Plans


Interactive Files
Visualization Tool
Related Links
Document Resources
NGSS Three Dimensional Learning
- See drop-down menu at the bottom of the page