Iceberg Diagram: A Systems Thinking Tool

About Iceberg Diagrams
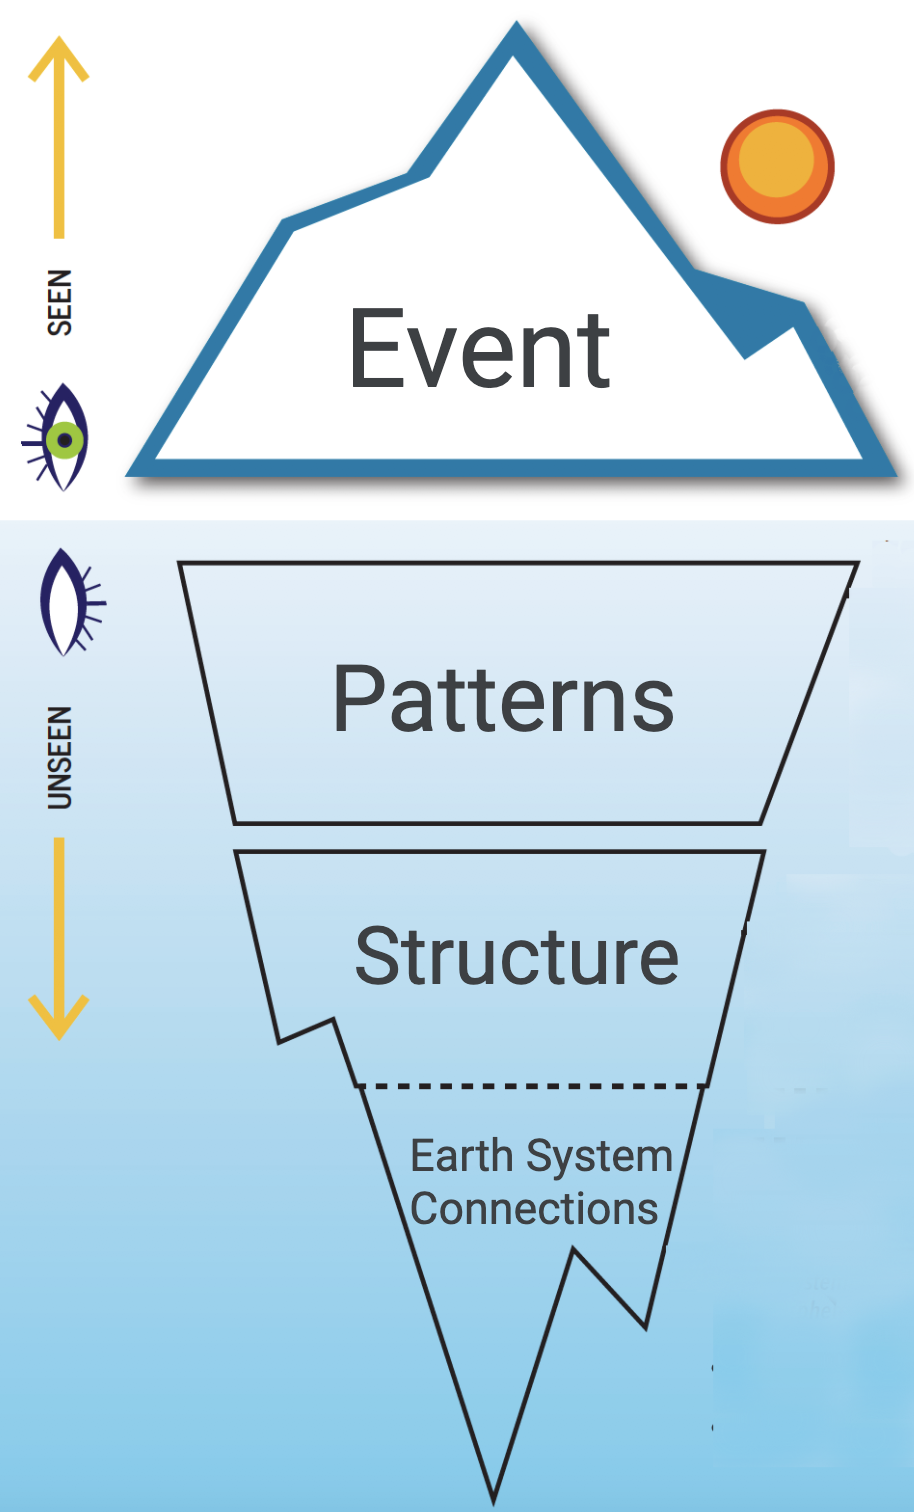
In Earth System Science, underling factors affecting observable phenomena can be difficult to identify and describe. This diagram uses the metaphor of an iceberg to demonstrate the idea of visible vs hidden as it relates to Earth science phenomena. This teaching strategy helps students to see beyond the obvious and to develop their awareness of the underlying causes, relationships, and/or conditions that can contribute to phenomenological events. It also provides a framework for digging deeper into phenomena-driven lessons in Earth Science.
Using Iceberg Diagrams
This tool helps students think about a phenomenon in four ways:
1. single or series of events to be described
2. patterns to be identified using mathematics
3. flows of energy and matter to analyzed
4. spheres of the Earth System to be connected
Understanding Iceberg Diagrams
EVENT: This stage involves learners making observations of the phenomenon as an event. Observations may come in the forms of local investigations in their school yard, experiments, data collected from field stations and satellites, etc. Learners also begin making predictions about why or how this phenomenon happens.
PATTERNS: Learners explore the data to identify patterns and relationships with respect to change over time, geographic location, etc. By looking for patterns, relationships (and the factors that influence them) may begin to emerge. Also, learners generate research questions.
STRUCTURE: Learners describe the fluctuations of energy and matter in the phenomenon, as well as relate scientific principles to them. These characteristics help the learner identify the boundaries of this phenomenon, its structure, and dynamics.
EARTH SYSTEM CONNECTIONS: Learners connect the phenomenon to the Earth System, as well as to human activities (found within the Biosphere).
Disciplinary Core Ideas:
- ESS2A: Earth Materials and Systems
- ESS2B: Plate Tectonics and Large-Scale Systems
- ESS2C: The Role of Water in Earth’s Surface Processes
- ESS2D: Weather and Climate
- ESS2E: Biogeology
- ESS3A: Natural Resources
- ESS3B: Natural Hazards
- ESS3C: Human Impacts on Earth Systems
- ESS3D: Global Climate Change
- ETS1A: Defining and Delimiting and Engineering Problem
Crosscutting Concepts:
- Patterns
- Cause and Effect
- Scale, Proportion, and Quantity
- Systems and System Models
- Structure and Function
- Stability and Change
Science and Engineering Practices:
- Developing and Using Models
- Analyzing and Interpreting Data
- Using Mathematics and Computational Thinking
- Constructing Explanations and Designing Solutions
- Engaging in Argument from Evidence
- Obtaining, Evaluating and Communicating Information

