

Grade Level: 6-8,
9-12
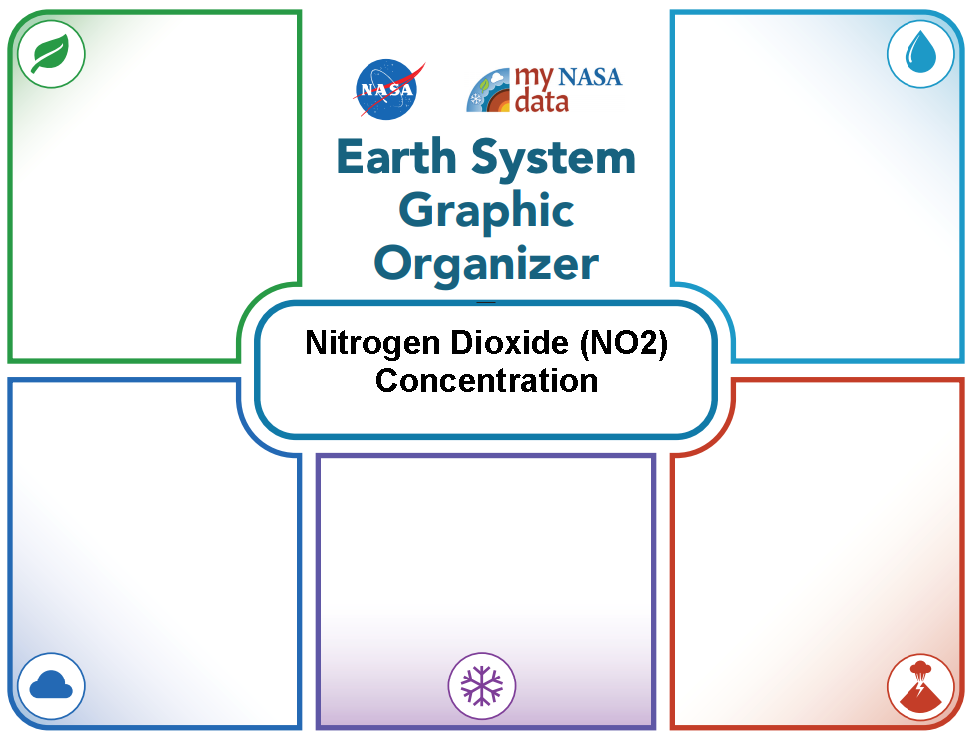
Students will explore the relationship between Nitrogen Dioxide and Precipitation in Earth's atmosphere. They will explore the data provided, make a claim, and complete a slide guided by a rubric.