Earth System Data Explorer
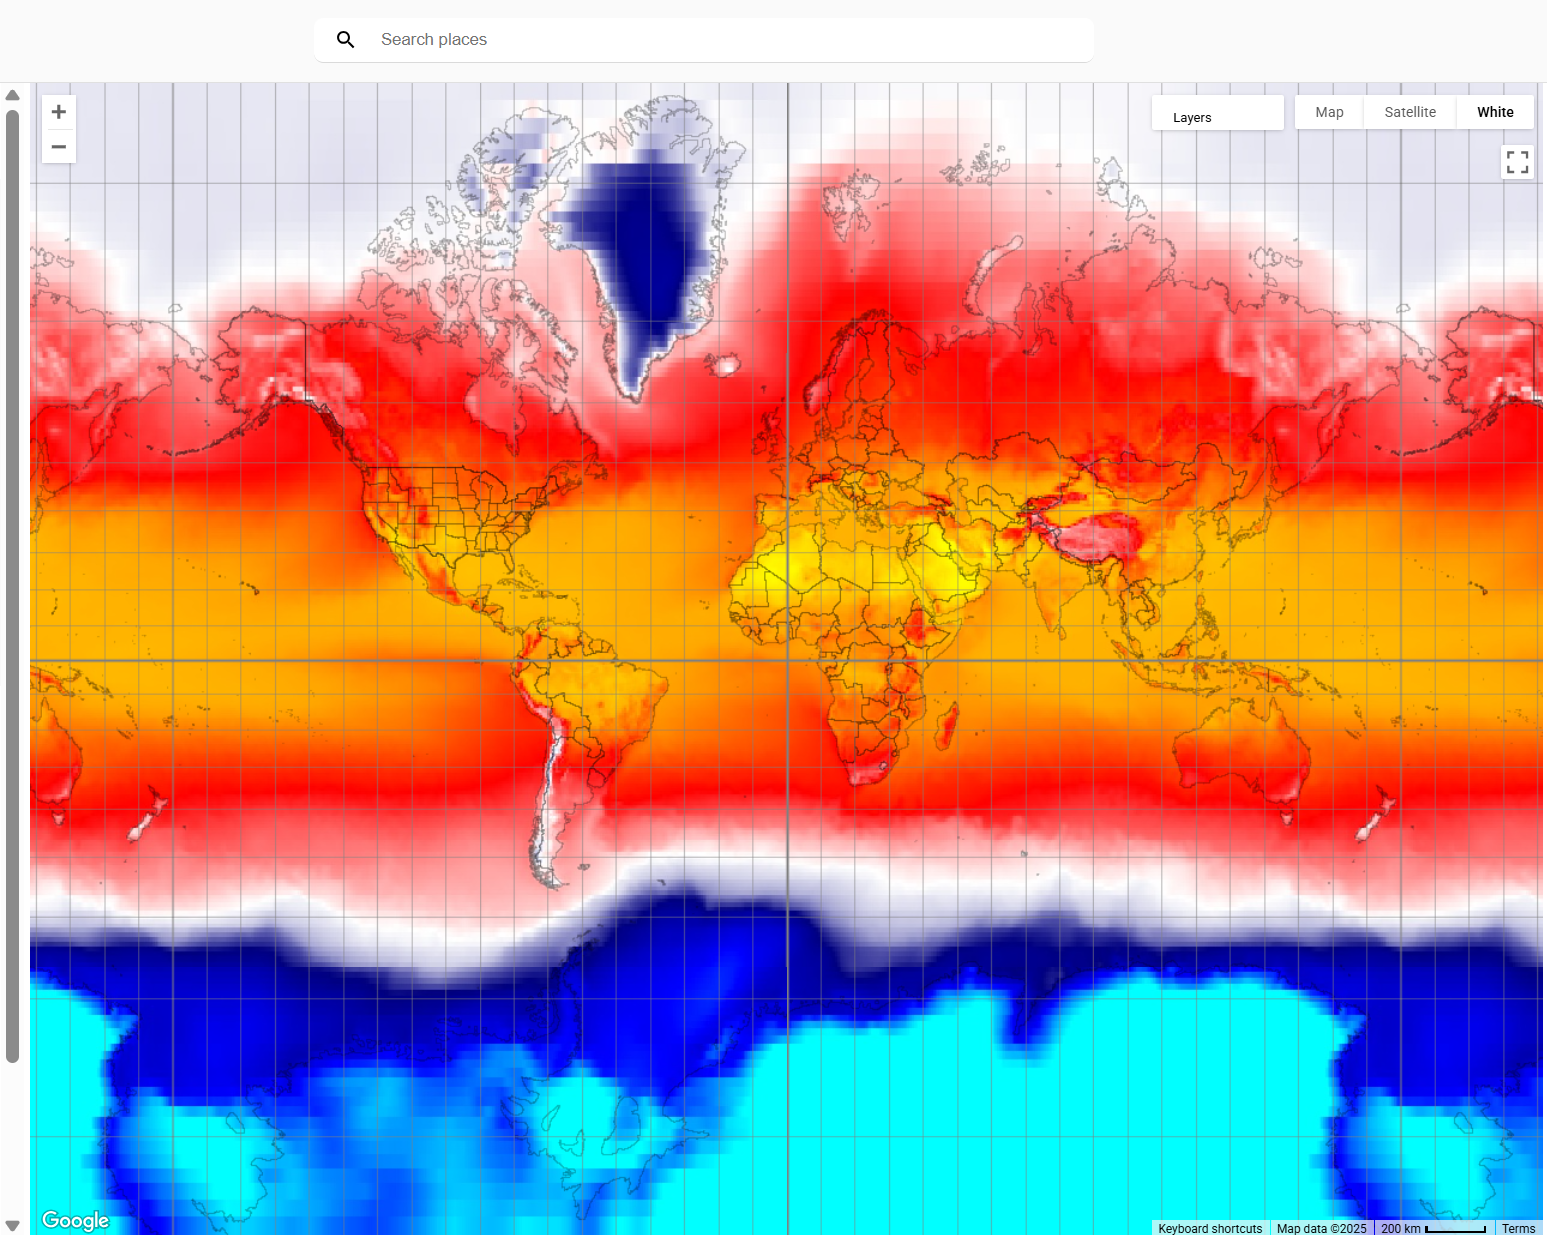
My NASA Data’s Earth System Data Explorer (ESDE) makes accessing and visualizing satellite data simple and engaging. This hands-on tool provides access to over 60 NASA datasets, enabling users to create local and global maps, plot data trends for a given location, and download information in user-friendly formats like CSV. ESDE’s plain-language summaries and intuitive interface empower educators to seamlessly integrate Earth and environmental data into lessons or allow students to independently explore Earth system connections on local, regional, and global scales.
To get started, access the Earth System Data Explorer visualization tool.
Frequently Asked Questions for the Earth System Data Explorer (ESDE)
- Is there a tutorial for how to use the ESDE?
Yes, you can get started with the Getting Started video or find tutorials on the Tutorials Page. - What are some of the key features of the ESDE?
Primary features of the tool include the ability to generate maps, graph, and data tables. Users can compare variables, read a plain language description of the data, explore data in a map for a specific location, make a time series graph for a selected location, and download data in easy-to-use (csv) format. Educators appreciate that you do not need to download software to access the tool. - What data sets are available through the ESDE?
A list of the datasets available can be found on the Data Collections: Earth System Data Explorer page. This page provides the following information for each dataset.- Earth System Sphere
- Category
- Name (The first word indicates the frequency such as daily, monthly, or yearly.)
- Date range for available data
- Where can I find data citations?
Additional information on the sources of the data are available on the Earth System Data Explorer Data Citations page. - Are there lesson plans using the ESDE?
- The Data Literacy Cube Guide is designed to be a flexible tool supporting students in analyzing Earth science maps, graphs, or data.
- There is also a series of six lesson plans that help learners visualize how different Earth system variables change over time, establish cause and effect relationships for a specific variable, identify patterns, and determine relationships among variables. These lessons, found at the bottom of the Analyzing Global Patterns with Earth System Satellite Images page, use curated maps from the ESDE.
- Where are the datasets for the Earth System Satellite Images found?
- To obtain maps for different time periods or geographical areas use the datasets on the Earth System Data Explorer.
- The variables featured in the Earth System Satellite Images can be found using the selection criteria identified.
- Aerosols
- Sphere: Atmosphere
- Category: Air Quality
- Dataset: Monthly Aerosol Optical Depth
- Clouds
- Sphere: Atmosphere
- Category: Air Quality
- Dataset: Monthly Total Cloud Cover
- Insolation (solar shortwave radiation)
- Sphere: Atmosphere
- Category: Longwave and Shortwave Radiation at the Earth's Surface
- Dataset: Monthly Flow of Energy into Surface at Earth's Surface
- Precipitation
- Sphere: Hydrosphere
- Category: Precipitation
- Dataset: Monthly Precipitation Rate (Combined Sources)
- Surface 'Skin" Temperature
- Sphere: Geosphere
- Category: Skin Temperature
- Dataset: Monthly Surface (Skin) Temperature
- Vegetation
- Sphere: Biosphere
- Category: Vegetation
- Dataset: Monthly Normalized Difference Vegetation Index
- Aerosols