Grade Level: 6-8
Students explore the spatial patterns observed in meteorological data and learn how this information is used to predict weather and understand climate behavior.
Select a Sphere:


Students explore the spatial patterns observed in meteorological data and learn how this information is used to predict weather and understand climate behavior.
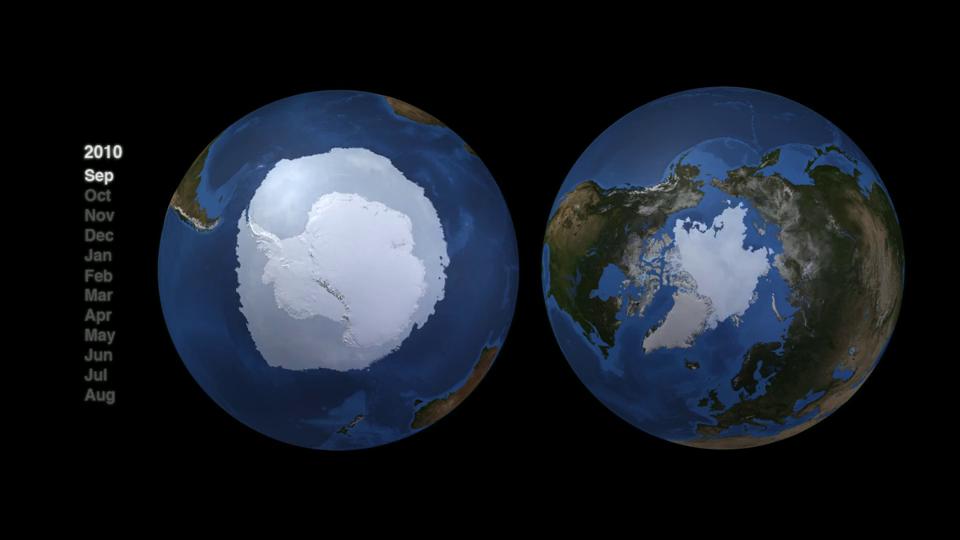
This mini lesson helps students visualize how the Hydrosphere and Cryosphere interact to produce changes in land and sea ice.
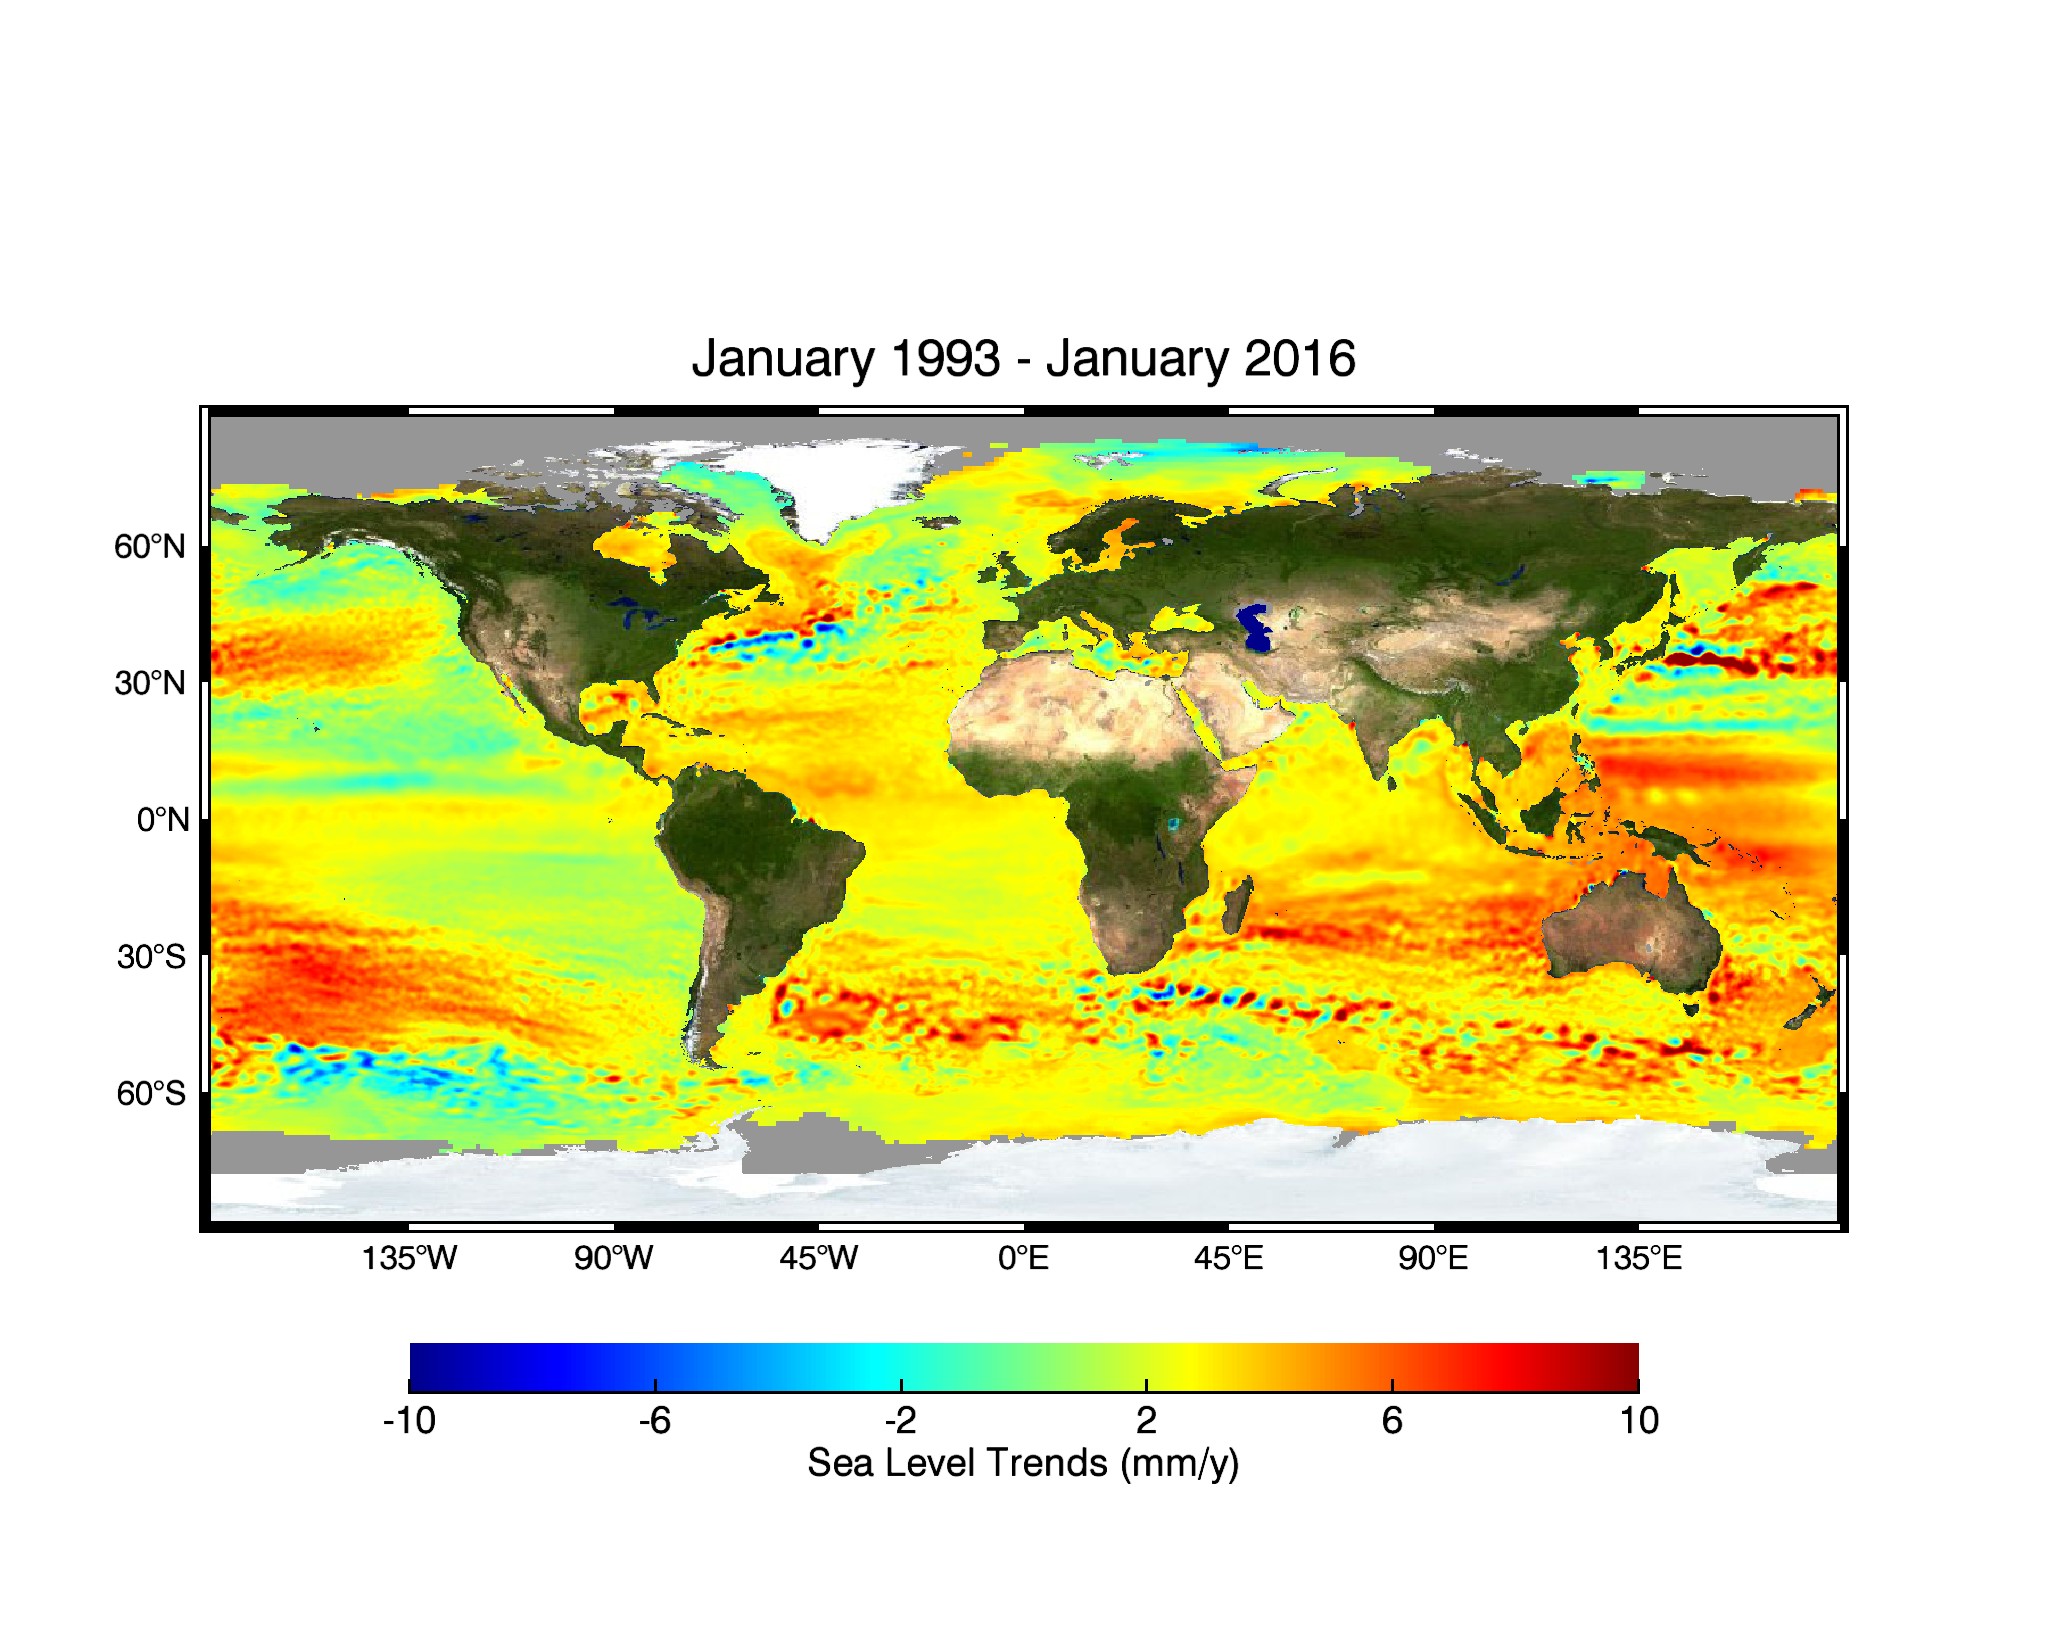
Students analyze four data visualizations focused on the topic of sea level. They use a jigsaw method to explore and communicate their findings to their peers.
The advance-and-retreat cycle of snow cover drastically changes the whiteness and brightness of Earth. Using two maps created using NASA satellite data for 2017, students review the seasonal differences of snow and ice extent and answer questions on their observations.
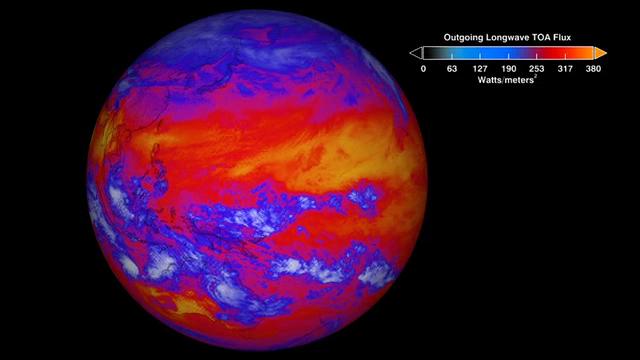
Students review a visualization showing a global view of the top-of-atmosphere longwave radiation from January 26 and 27, 2012. They review the supporting text and analyze the data in the visualization to answer questions.
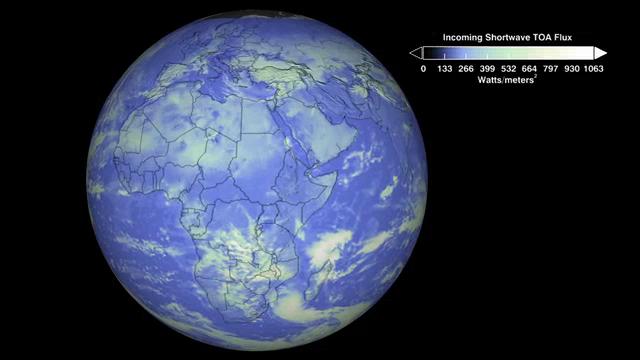
Students review a video showing a global view of the top-of-atmosphere shortwave radiation from January 26 and 27, 2012 and answer the questions that follow.
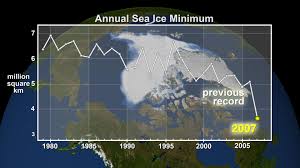
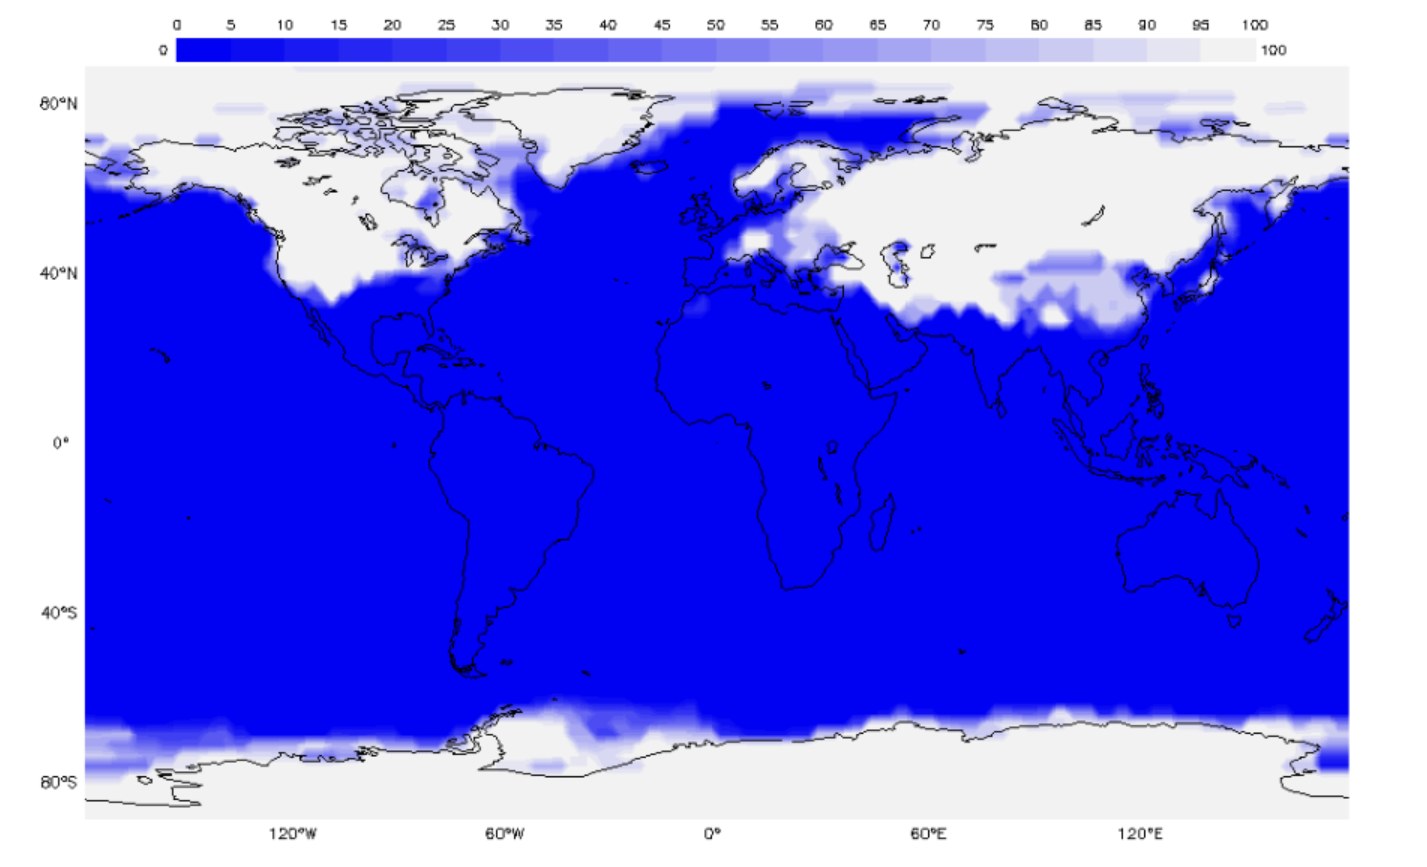
Arctic sea ice is the cap of frozen seawater blanketing most of the Arctic Ocean and neighboring seas in wintertime. It follows seasonal patterns of thickening and melting. Students view how the quantity has changed from 1979 through 2018.
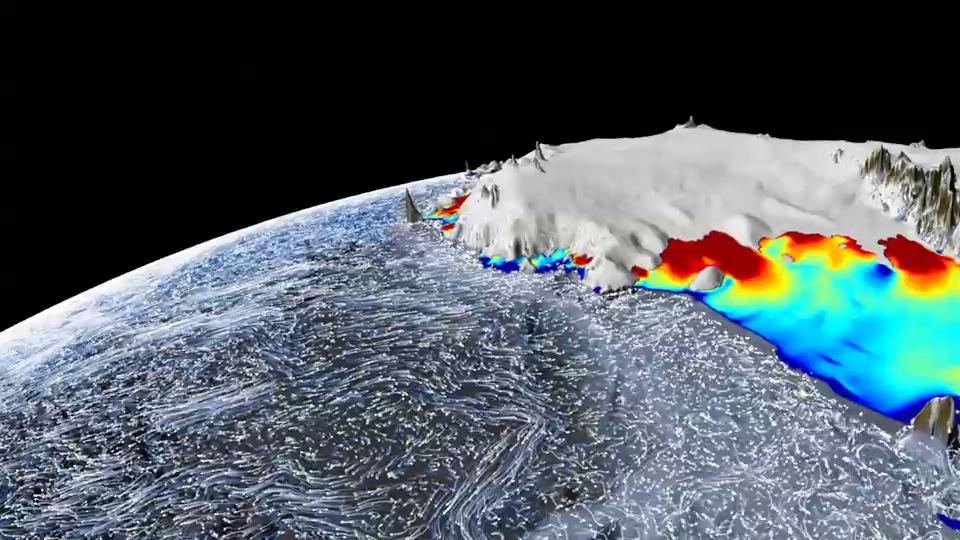
Students examine the two time series images to determine the differences between seasonal ice melt over water versus land.
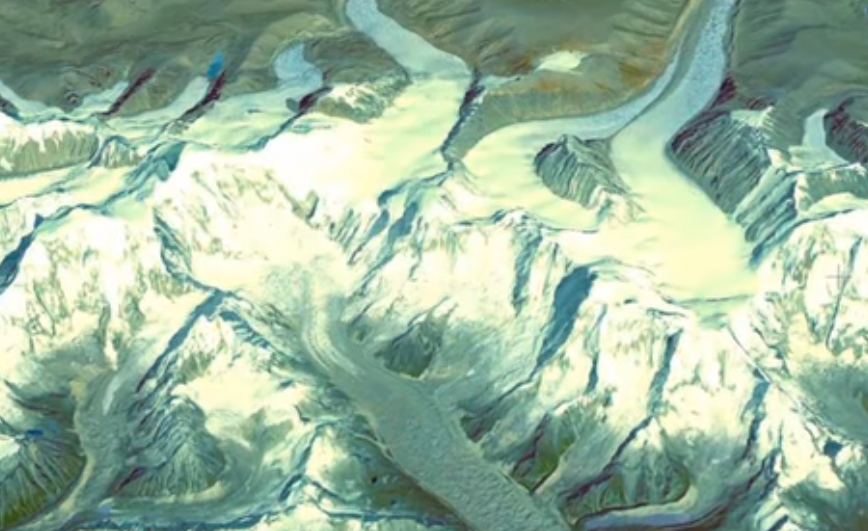
Students will watch a video on the Greenland Ice Sheet and answer questions.
Students watch the video Frozen Earth and answer the following questions that discuss how ice helps moderate the planet's temperature using NASA satellites.
Mini lessons are intended to be short engagement activities that teachers may assign as bell-ringers, exit slips, or parts of larger learning lessons. These include activities where students interact with NASA maps, graphs, and datasets from the atmosphere, biosphere, cryosphere, geosphere, hydrosphere and the earth system.

