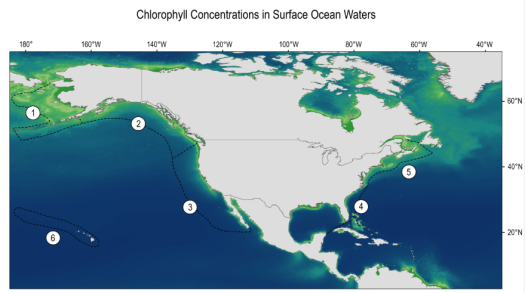
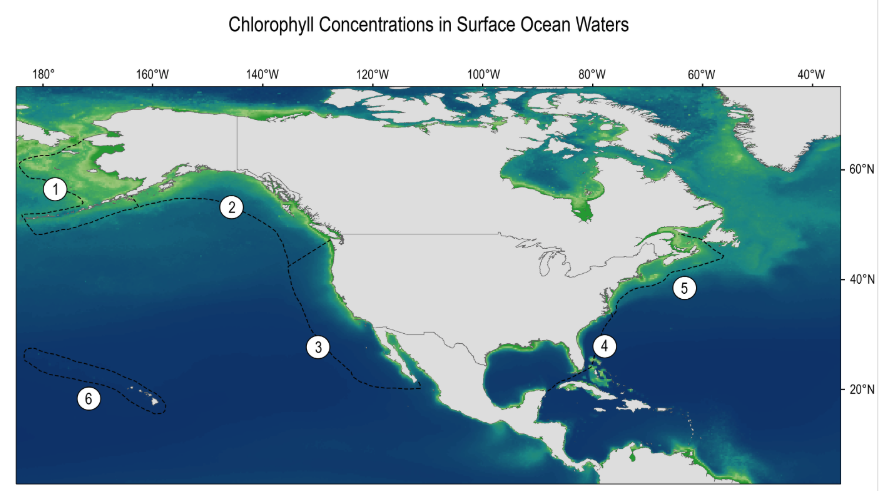
Students will analyze the mapped plot of the historic Ocean Chlorophyll Concentrations at key locations around the world for the period of 1998-2018.
loading Biosphere...
Featured Mini Lessons
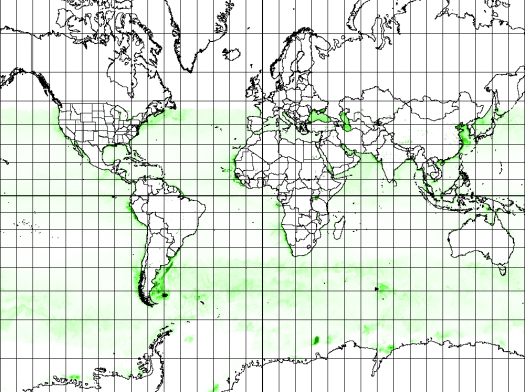
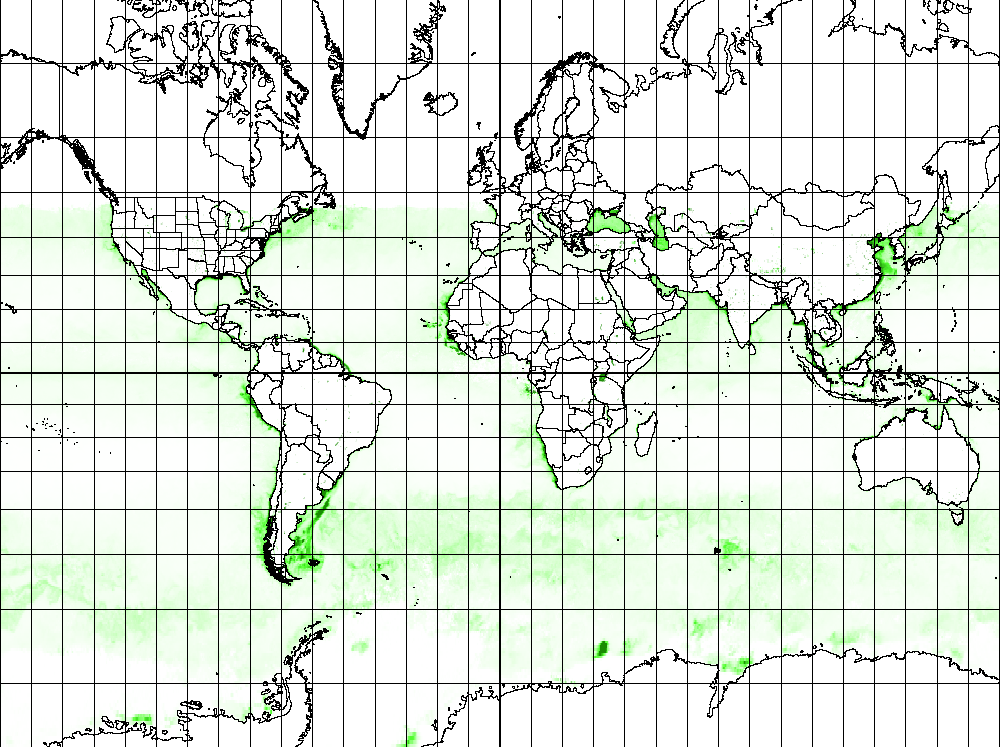
Students will analyze the monthly seasonal chlorophyll concentration images in our global oceans for the four different months of 2024, and then answer the following questions.
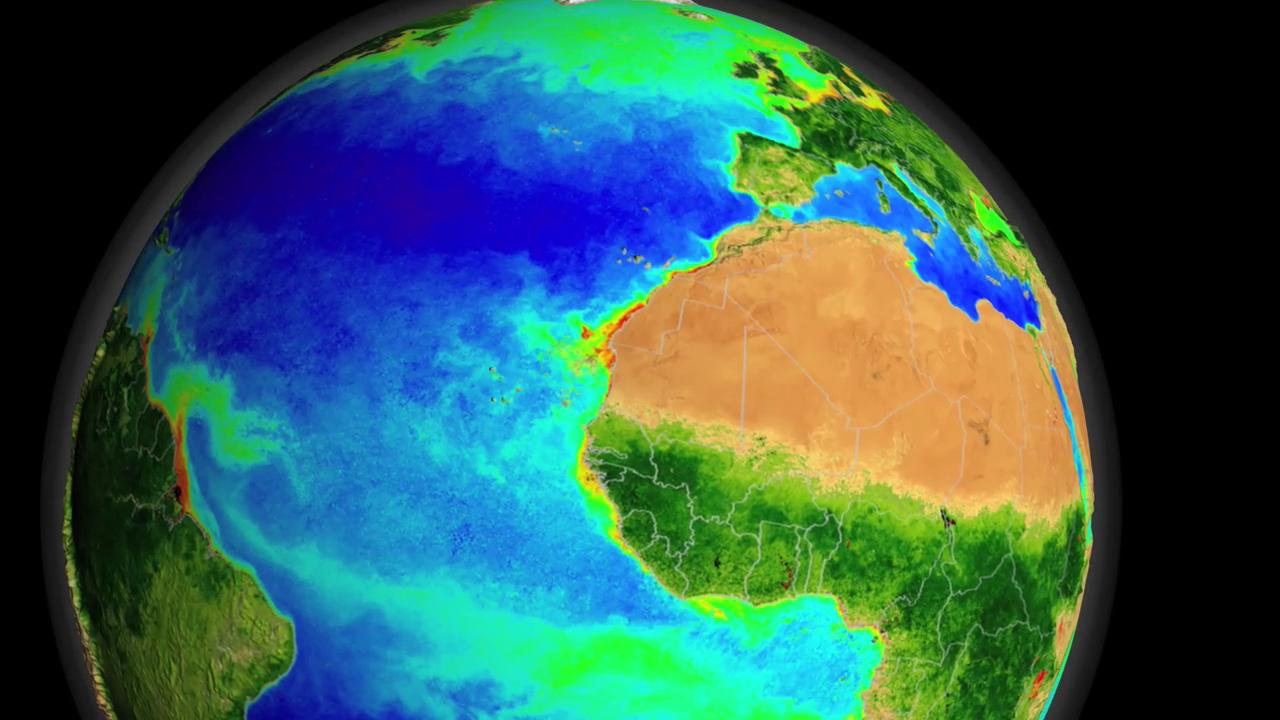
Students review the NASA video showing biosphere data over the North Atlantic Ocean as a time series animation displaying a decade of phytoplankton blooms and answer questions.
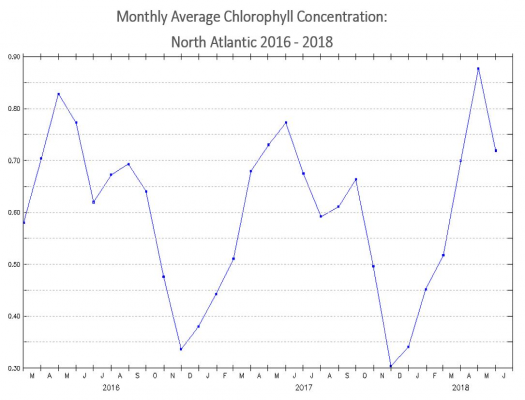
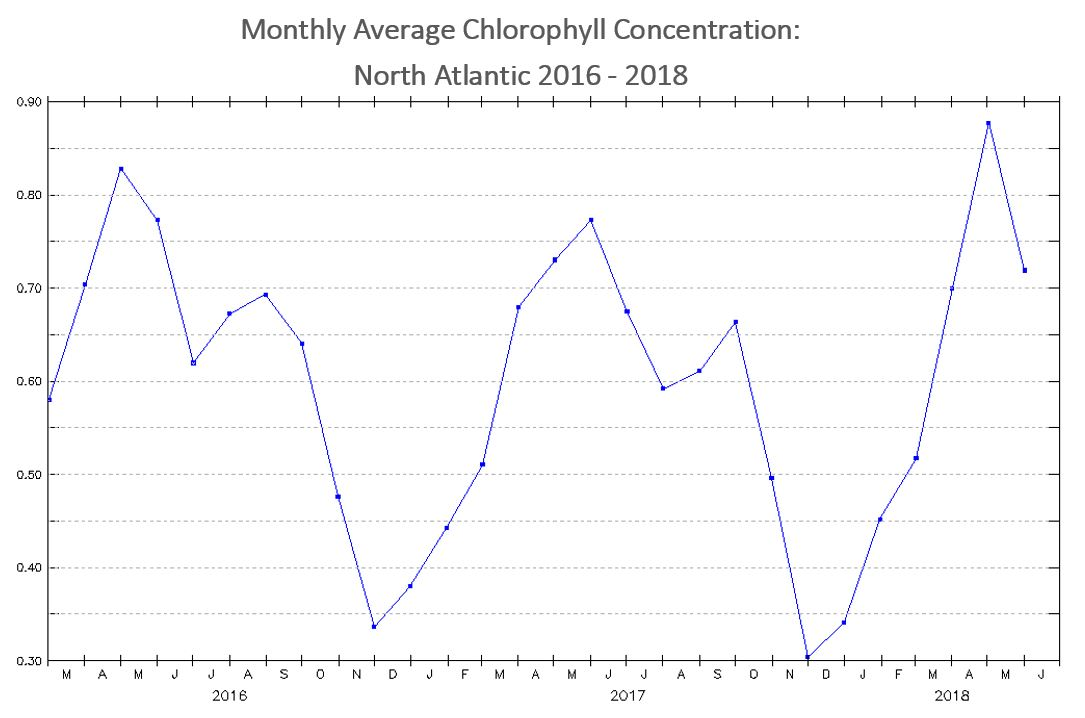
In this mini lesson, students explore the relationship of chlorophyll and solar radiation by analyzing line graphs from the North Atlantic during 2016-2018.
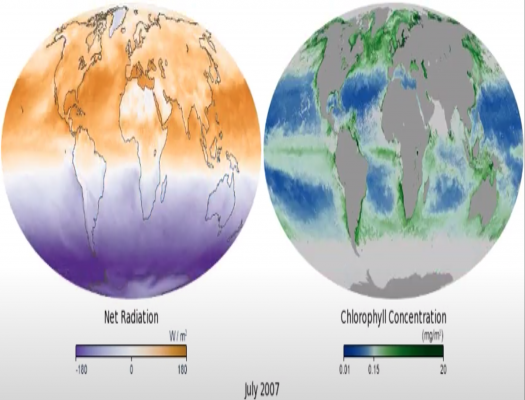
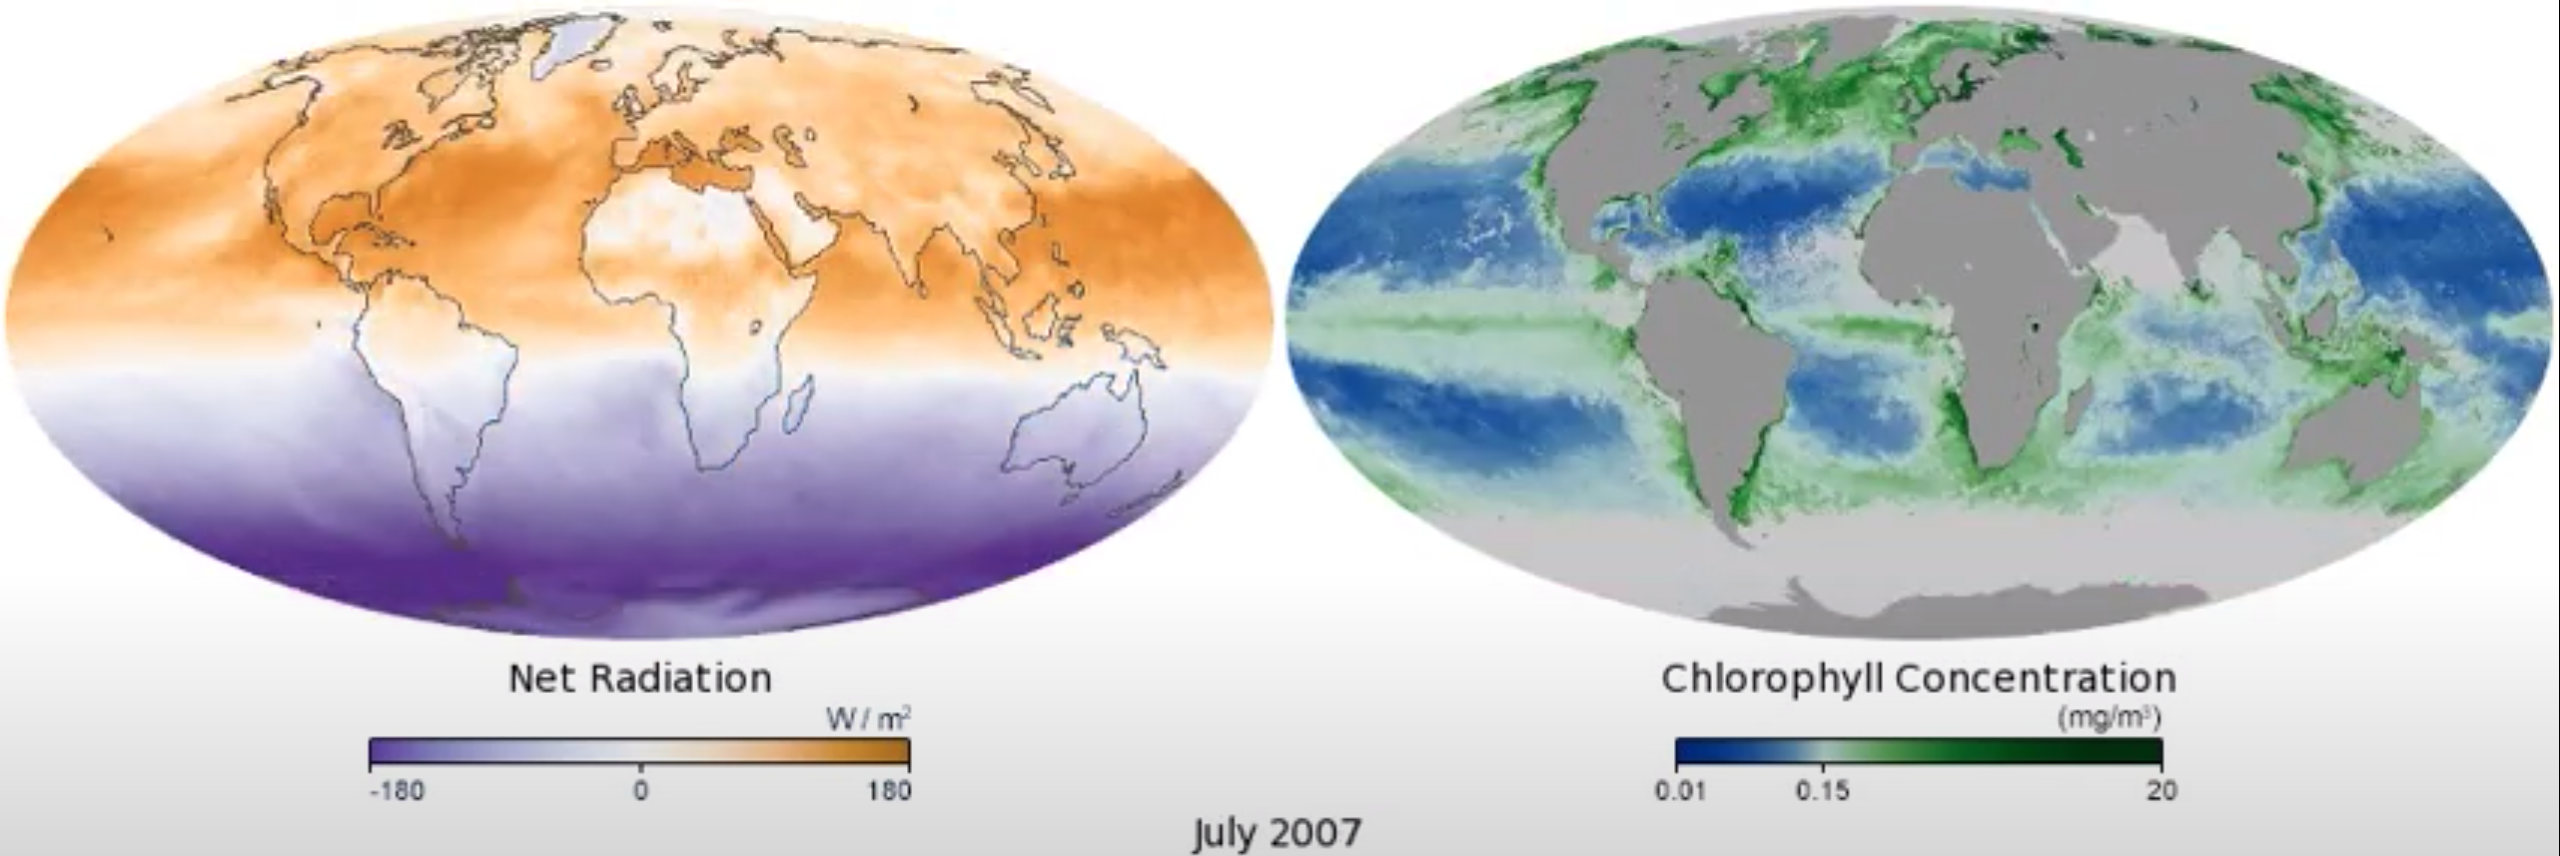
This mini lesson engages students by watching a NASA video related to seasonal chlorophyll concentration as it relates to net radiation using NASA's Aqua satellite. Students will examine the model and answer the questions.


