
Grade Level: 3-5
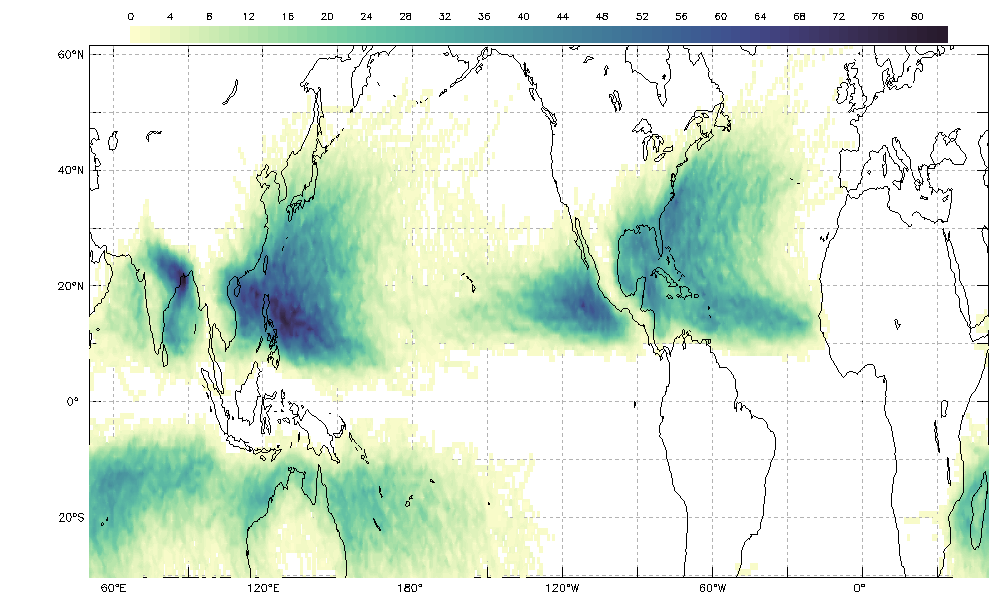
Interpret the map, or model, to find patterns in the occurrence of tropical cyclones from 1842 through 2018.
Hurricanes are large, swirling storms with winds of 119 kilometers per hour (74 mph) or higher. That's quicker than a cheetah can run which is the fastest animal on land. They are said to be the most violent storms on Earth. These storms are also called by other names, such as typhoons or cyclones, depending on where they occur.


Interpret the map, or model, to find patterns in the occurrence of tropical cyclones from 1842 through 2018.
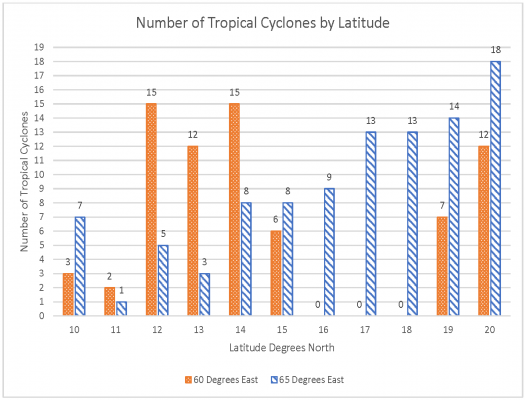

Students interpret a double bar/column chart comparing the number of tropical cyclones in different locations.
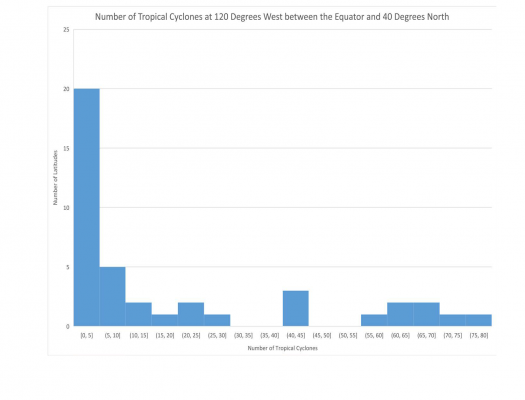
Compare a histogram and map to determine the differences in the information conveyed in each data display.

Learners will analyze and interpret a box plot and evaluate the spread of the data. Learners will compare it with a different visualization of the data to see how the two compare, discuss the limitations of the two types of data displays and formulate questions.

Interpret a scatter plot to find patterns in the number of tropical cyclones from 1842 to 2018.
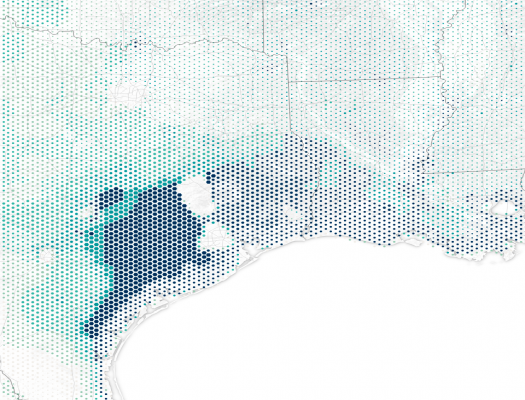
In this mini-lesson, students analyze soil moisture quantities associated with Hurricane Harvey around Houston, Texas on August 25, 2017.
Interpret the map, or model, to find patterns in the occurrence of tropical cyclones from 1842 through 2018.
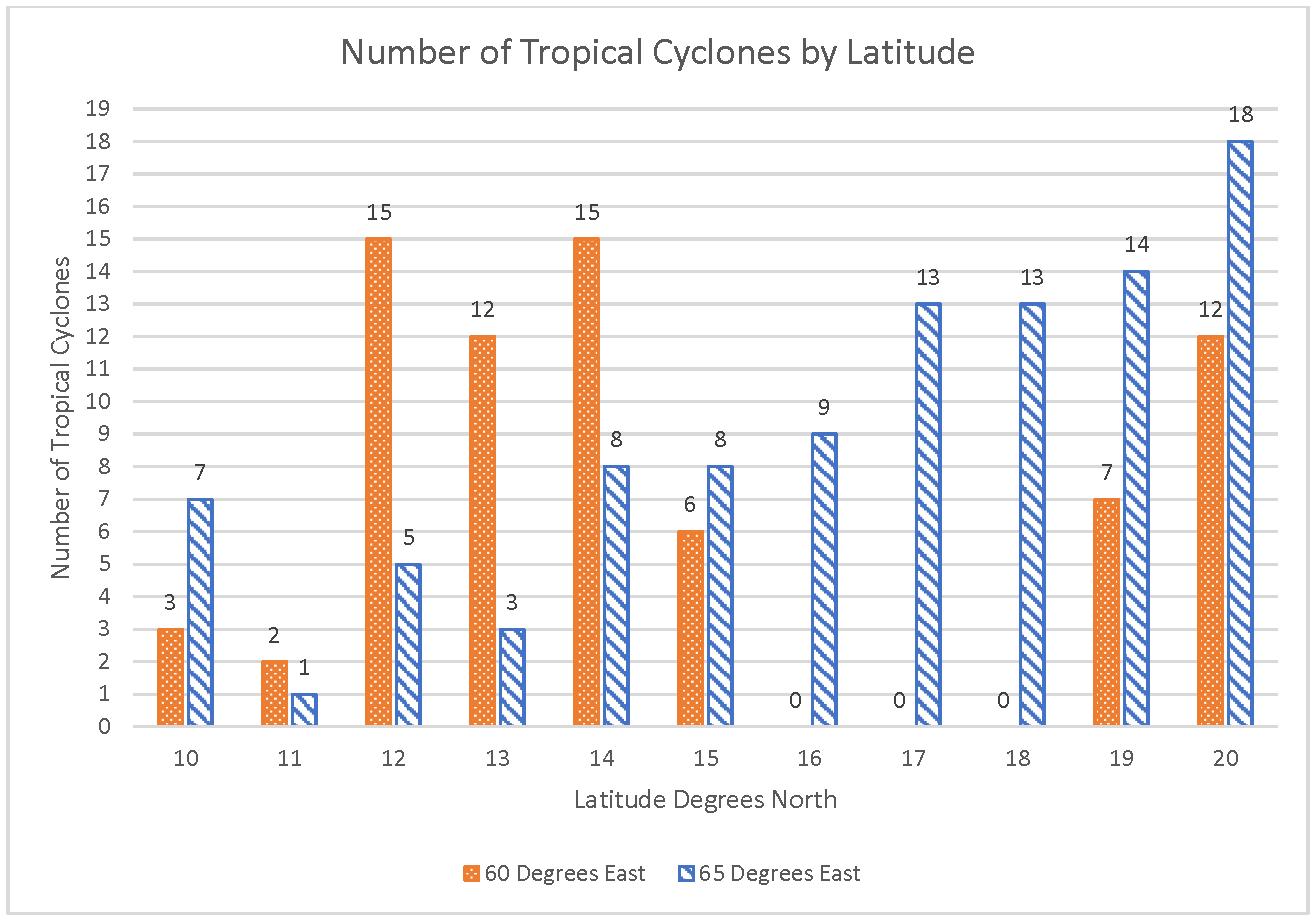
Students interpret a double bar/column chart comparing the number of tropical cyclones in different locations.

Compare a histogram and map to determine the differences in the information conveyed in each data display.
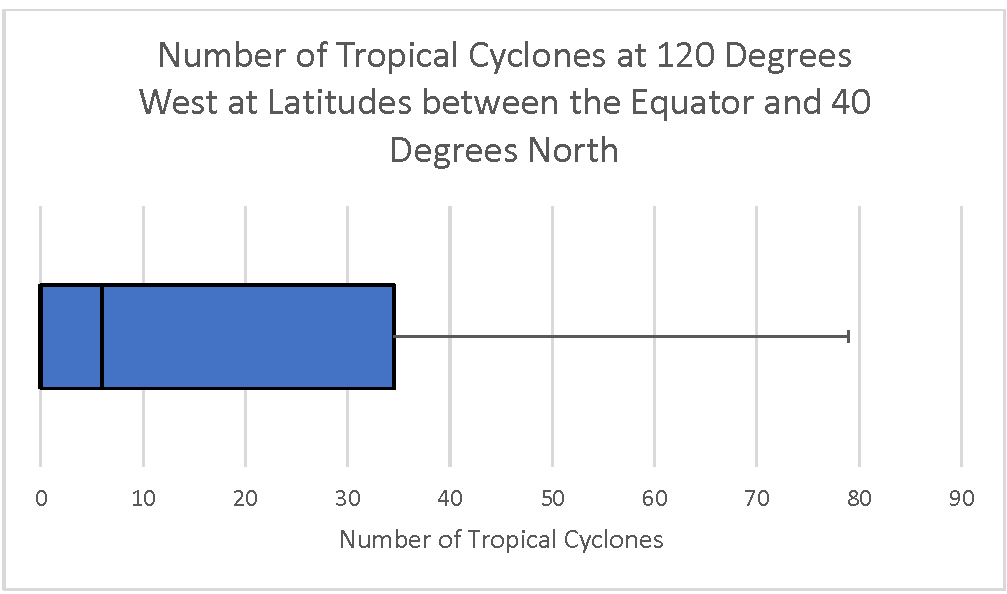
Learners will analyze and interpret a box plot and evaluate the spread of the data. Learners will compare it with a different visualization of the data to see how the two compare, discuss the limitations of the two types of data displays and formulate questions.
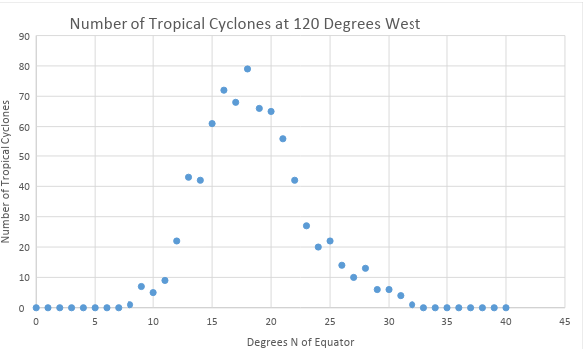
Interpret a scatter plot to find patterns in the number of tropical cyclones from 1842 to 2018.

In this mini-lesson, students analyze soil moisture quantities associated with Hurricane Harvey around Houston, Texas on August 25, 2017.
