Mini Lesson/Activity
Tropical Cyclone Counts Bar/Column Chart
Overview
Interpret a double bar/column chart comparing the number of tropical cyclones in different locations.
Student Directions
Tropical cyclones are sometimes called hurricanes or typhoons. Some areas of the world have more tropical cyclones than others.
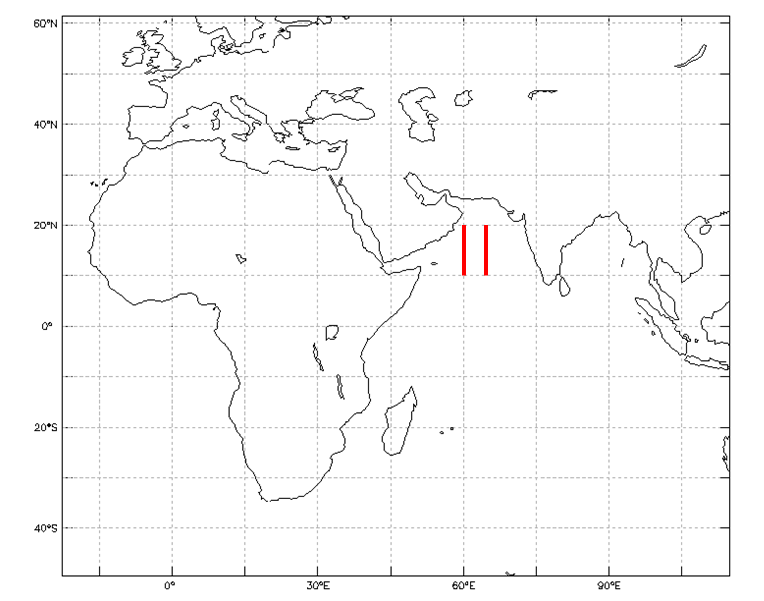
The map below has two thick, red lines. These show the areas that the graph represents.
https://mynasadata.larc.nasa.gov/sites/default/files/inline-images/Blank%20map%20with%20marked%20location%20cropped.png
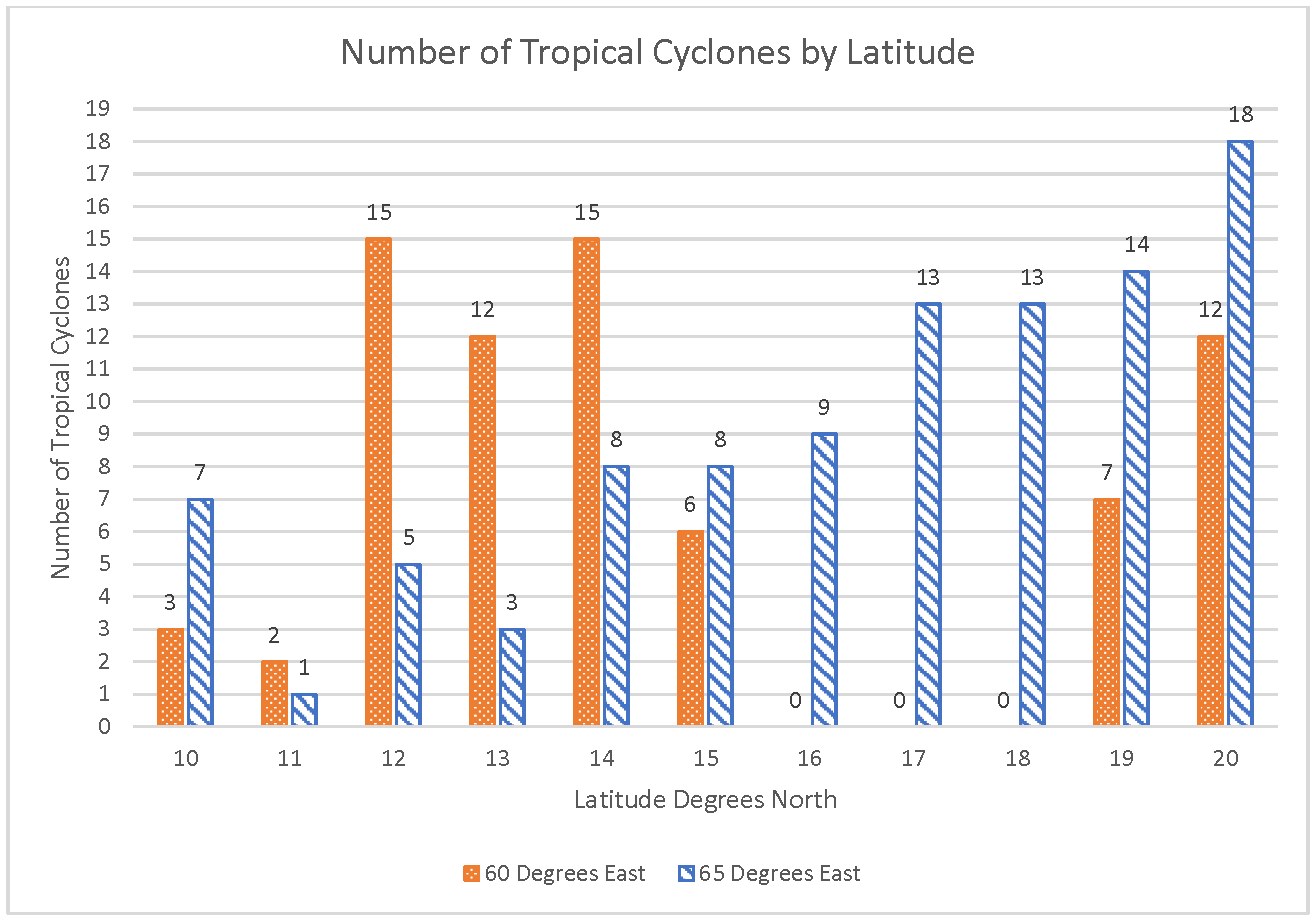
The graph below shows the number of tropical cyclones between 1842 and 2018 at several locations. These locations are the latitudes from 10 degrees north to 20 degrees north. The orange bars, or columns, show the number of hurricanes at 60° east. The blue bars, or columns, show the number of hurricanes at 65° east.
https://mynasadata.larc.nasa.gov/sites/default/files/2022-01/Bar_column%20chart%20cropped.png
Steps
- Analyze the Tropical Cyclone Counts by Latitude graph and answer the questions. Check with your instructor on how to submit your answers.
- At 14° north, how many more tropical cyclones were at 60° east than at 65° east?
- At 60° east, how many more tropical cyclones were at 14° north than at 15° north?
- What was the total number of tropical cyclones at each latitude between 60° and 65° east?
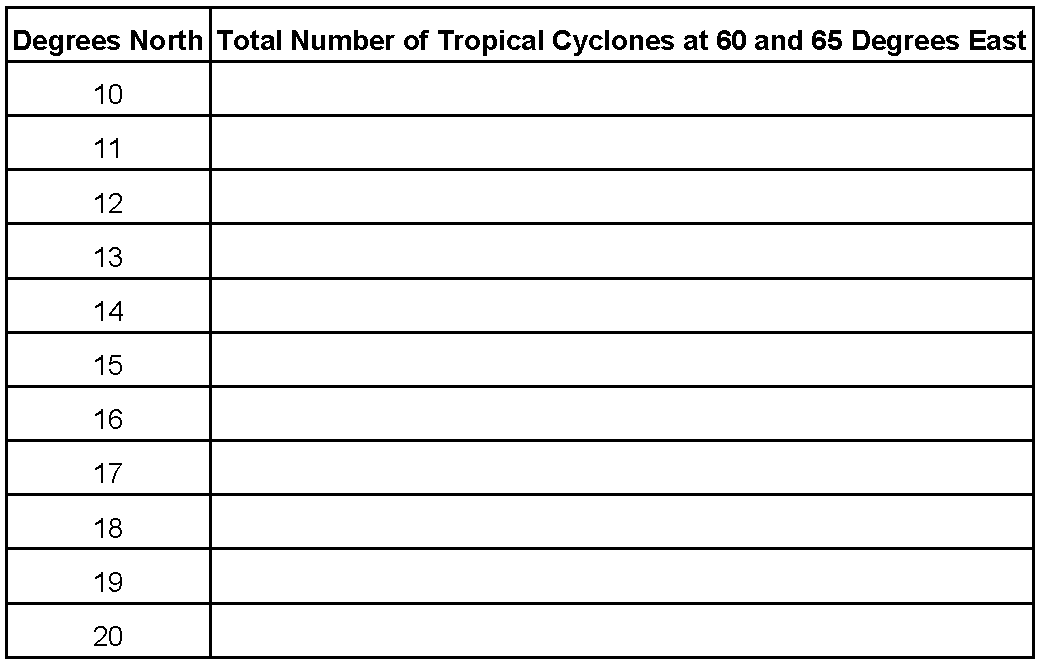
- Which latitude had the highest total number of tropical cyclones at these longitudes?
- How many fewer total tropical cyclones were at 15° north than at 14° north at these longitudes?
Teacher Note
Teachers, these mini lessons/student activities are perfect "warm up" tasks that can be used as a hook, bell ringer, exit slip, etc. They take less than a class period to complete. Learn more on the "My NASA Data What are Mini Lessons?" page.
Teachers who are interested in receiving the answer key, please complete the Teacher Key Request and Verification Form. We verify that requestors are teachers prior to sending access to the answer keys as we’ve had many students try to pass as teachers to gain access.
Disciplinary Core Ideas:
- ESS2A: Earth Materials and Systems
Crosscutting Concepts:
- Patterns
- Scale, Proportion, and Quantity
Science and Engineering Practices:
- Developing and Using Models
- Analyzing and Interpreting Data

