Tutorials for using the Earth System Data Explorer
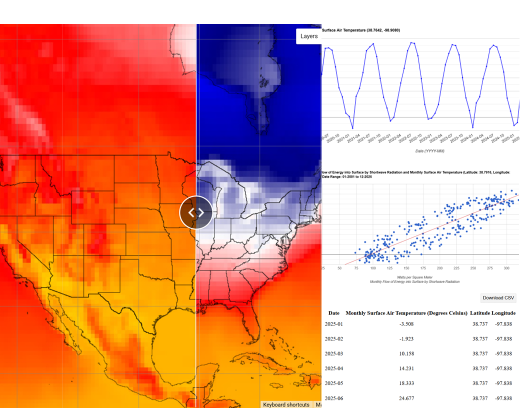
The Introduction to the Earth System Data Explorer tutorial will help you get started and will provide the first steps for anything you want to do using the tool. There are seven additional tutorials detailing each of the different analysis and data download tools.
Additional Earth System Data Explorer Videos
- Compare Two/Swipe and Side-by-Side - Learn how to view more than one map at a time using either the Compare Two/Swipe or Side-by-Side tool.
- Identify - Learn how to use the Identify tool to find data values for specific locations.
- Time Plot - Learn how to use the the Time Plot analysis tool to create single and double line plots over time.
- Time Series Data Table - Learn how to generate a data table for up to four variables over time for one location and download the data as a CSV file.
- Scatter Plot - Learn how to create a scatter plot with two variables including options to add a trendline, equation, and/or R squared value.
- Create Your Own Data Table - Learn how to generate a data download table for one variable at different locations and/or for different times.
- Generate Download Image - Learn how to generate a .png file of the map displayed on the screen for download.
- The full playlist has all the videos listed.