About The Website

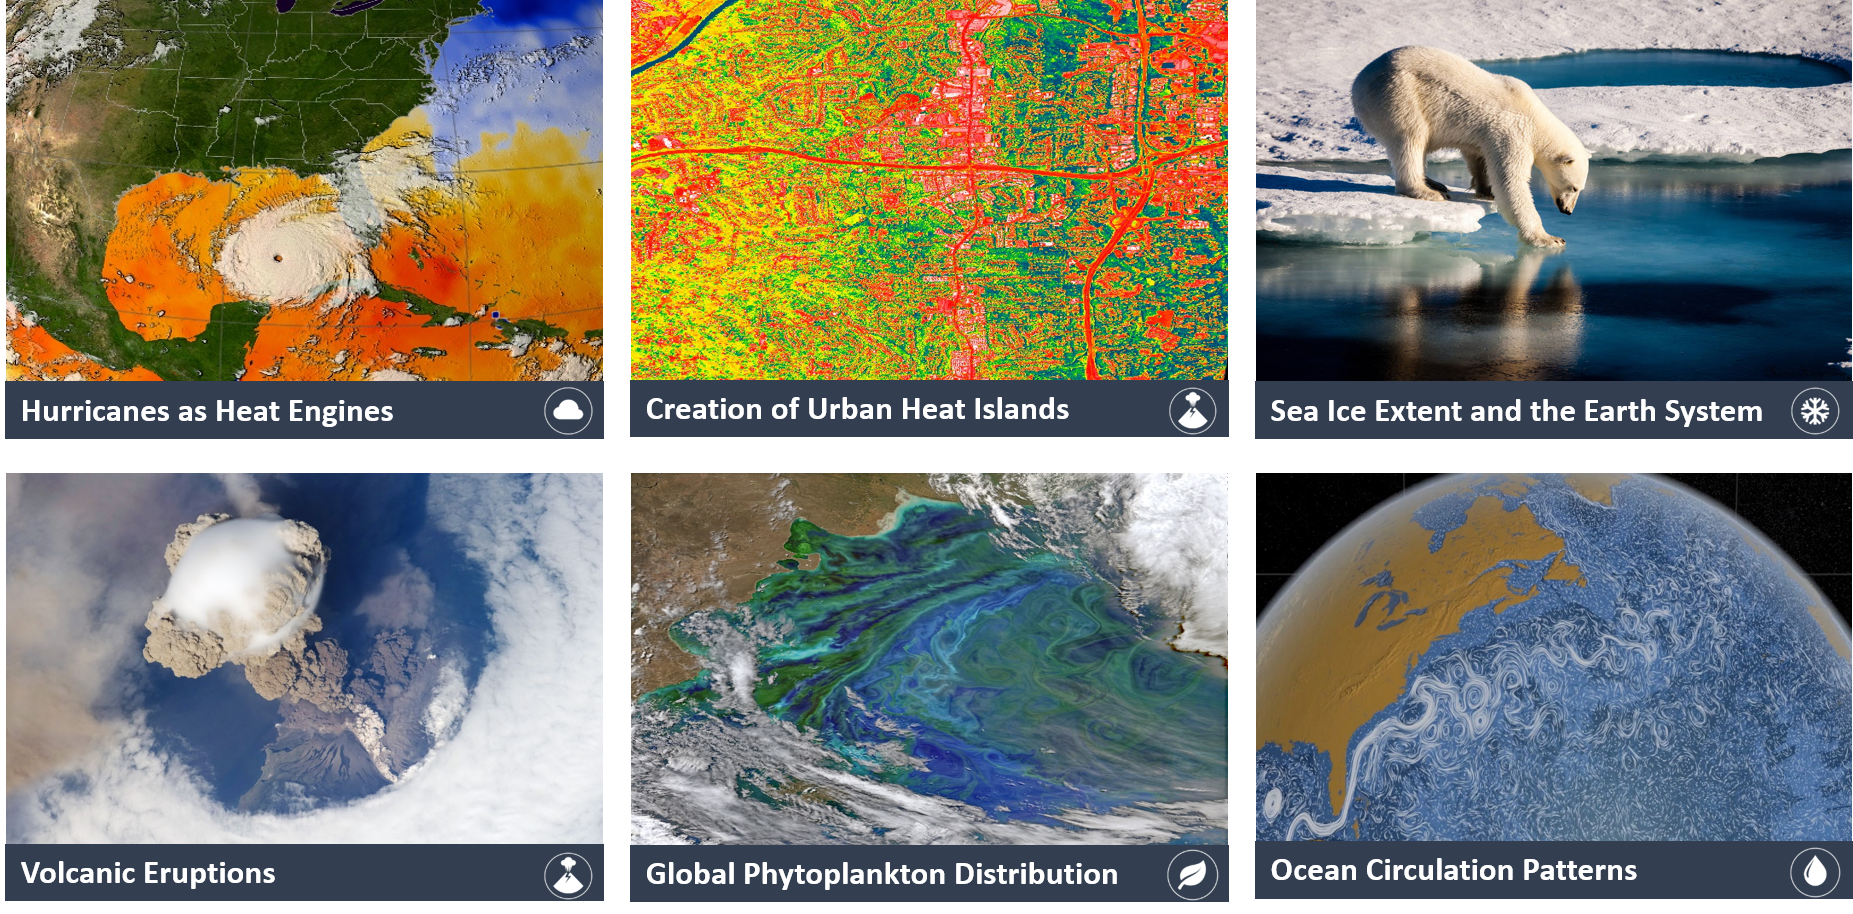
The My NASA Data website offers a variety of opportunities to explore Earth Science phenomena of the Atmosphere, Biosphere, Cryosphere, Geosphere, and Hydrosphere using uniquely NASA related content.
Are you looking for a more immersive way to get to know My NASA Data? Check out the StoryMap and the Scavenger Hunt below:
My NASA Data features the following content types in each of the sphere pages:
Mini Lessons (Student Activities)
See all Mini Lessons
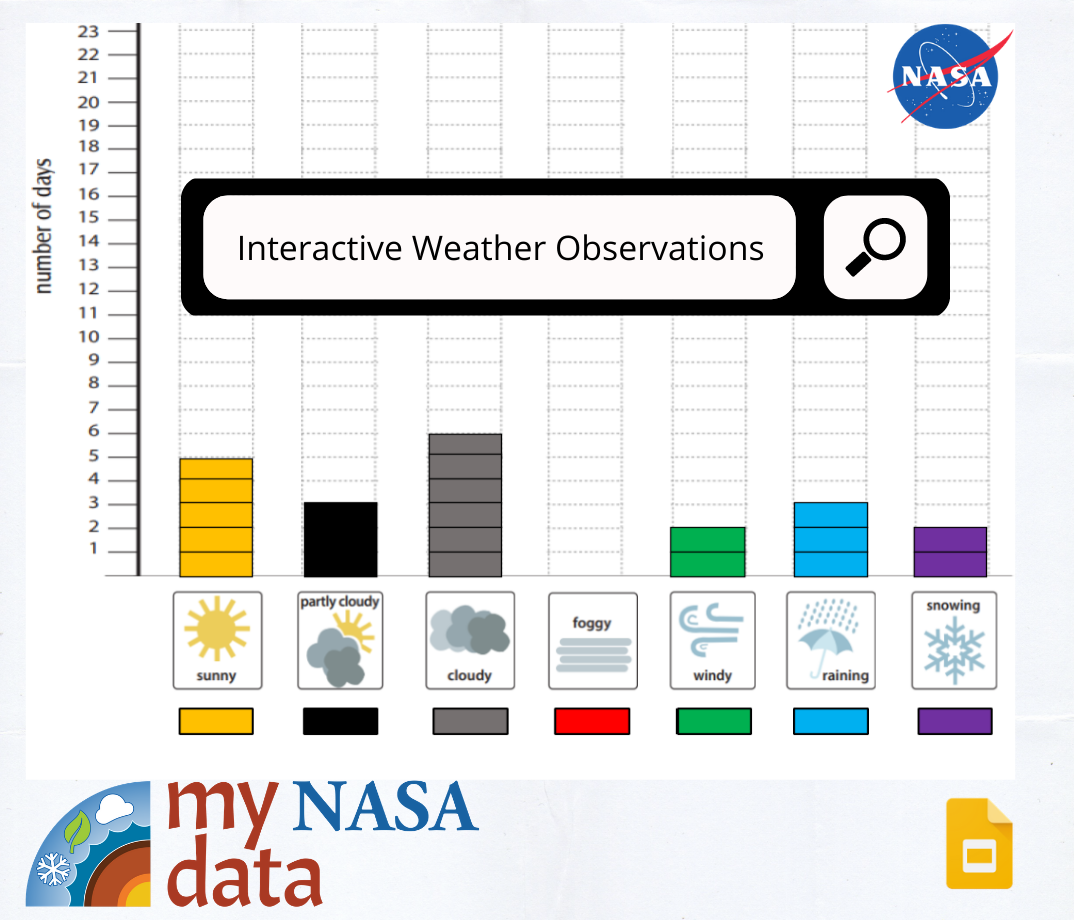
These sections feature online resources to help teachers and students access NASA data in a variety of formats. MND offers pre-generated graphs, mapped visualizations, animations, and processed data based on NGSS phenomena, providing the learner with the opportunity to explore concepts without being encumbered by visualization interfaces. These flexible resources provide guiding questions and other teacher tools so you can use them to open or close your class activity.
Lesson Plans
See all Lesson Plans
Our lesson plans feature a variety of NASA and related lesson plans for grades 3-12 that align with NGSS Earth Systems phenomena that a focus on data collection and analysis. Most of the lessons incorporate maps and data without having to teach students spreadsheet skills, have 1:1 student/computer ratio, or rely on computers that may have outdated/incompatible software.
StoryMaps
See all StoryMaps
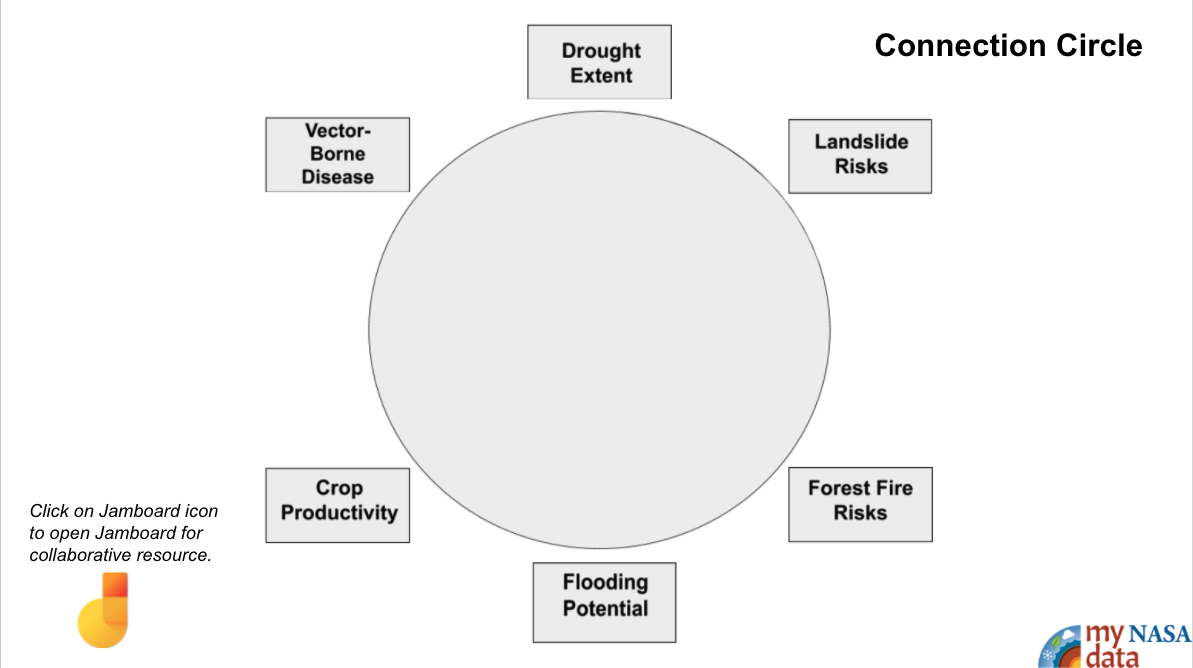
You will not want to miss our StoryMaps for grades 3-12 that are immersive data-rich experiences that engage students in data models in a 5 E learning cycle. These, too, are aligned with NGSS 3 Dimensions and Earth Systems phenomena that a focus on data collection and analysis.
STEM Career Connections
See all STEM Career Connections
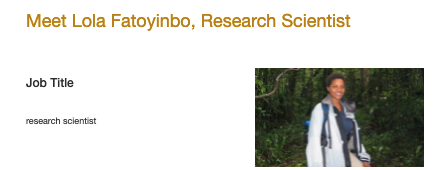
My NASA Data (MND) offers resources to help students explore careers related to Earth Systems missions at NASA. Students may review job profiles within the four disciplines of STEM (Science, Technology, Engineering, and Mathematics) aligned with projects in the Atmosphere, Biosphere, Cryosphere, Geosphere, and Hydrosphere and learn about real NASA employees who serve in those careers. Information on work description, job significance to NASA Earth Science, salaries, educational requirements, and more are provided.
GLOBE Connections
See all GLOBE Connections
These sections highlight related GLOBE data measurement protocols, activities, and resources that support the learning and exploration of featured phenomena of the Atmosphere, Biosphere, Cryosphere, Geosphere, and Hydrosphere...right in your backyard!

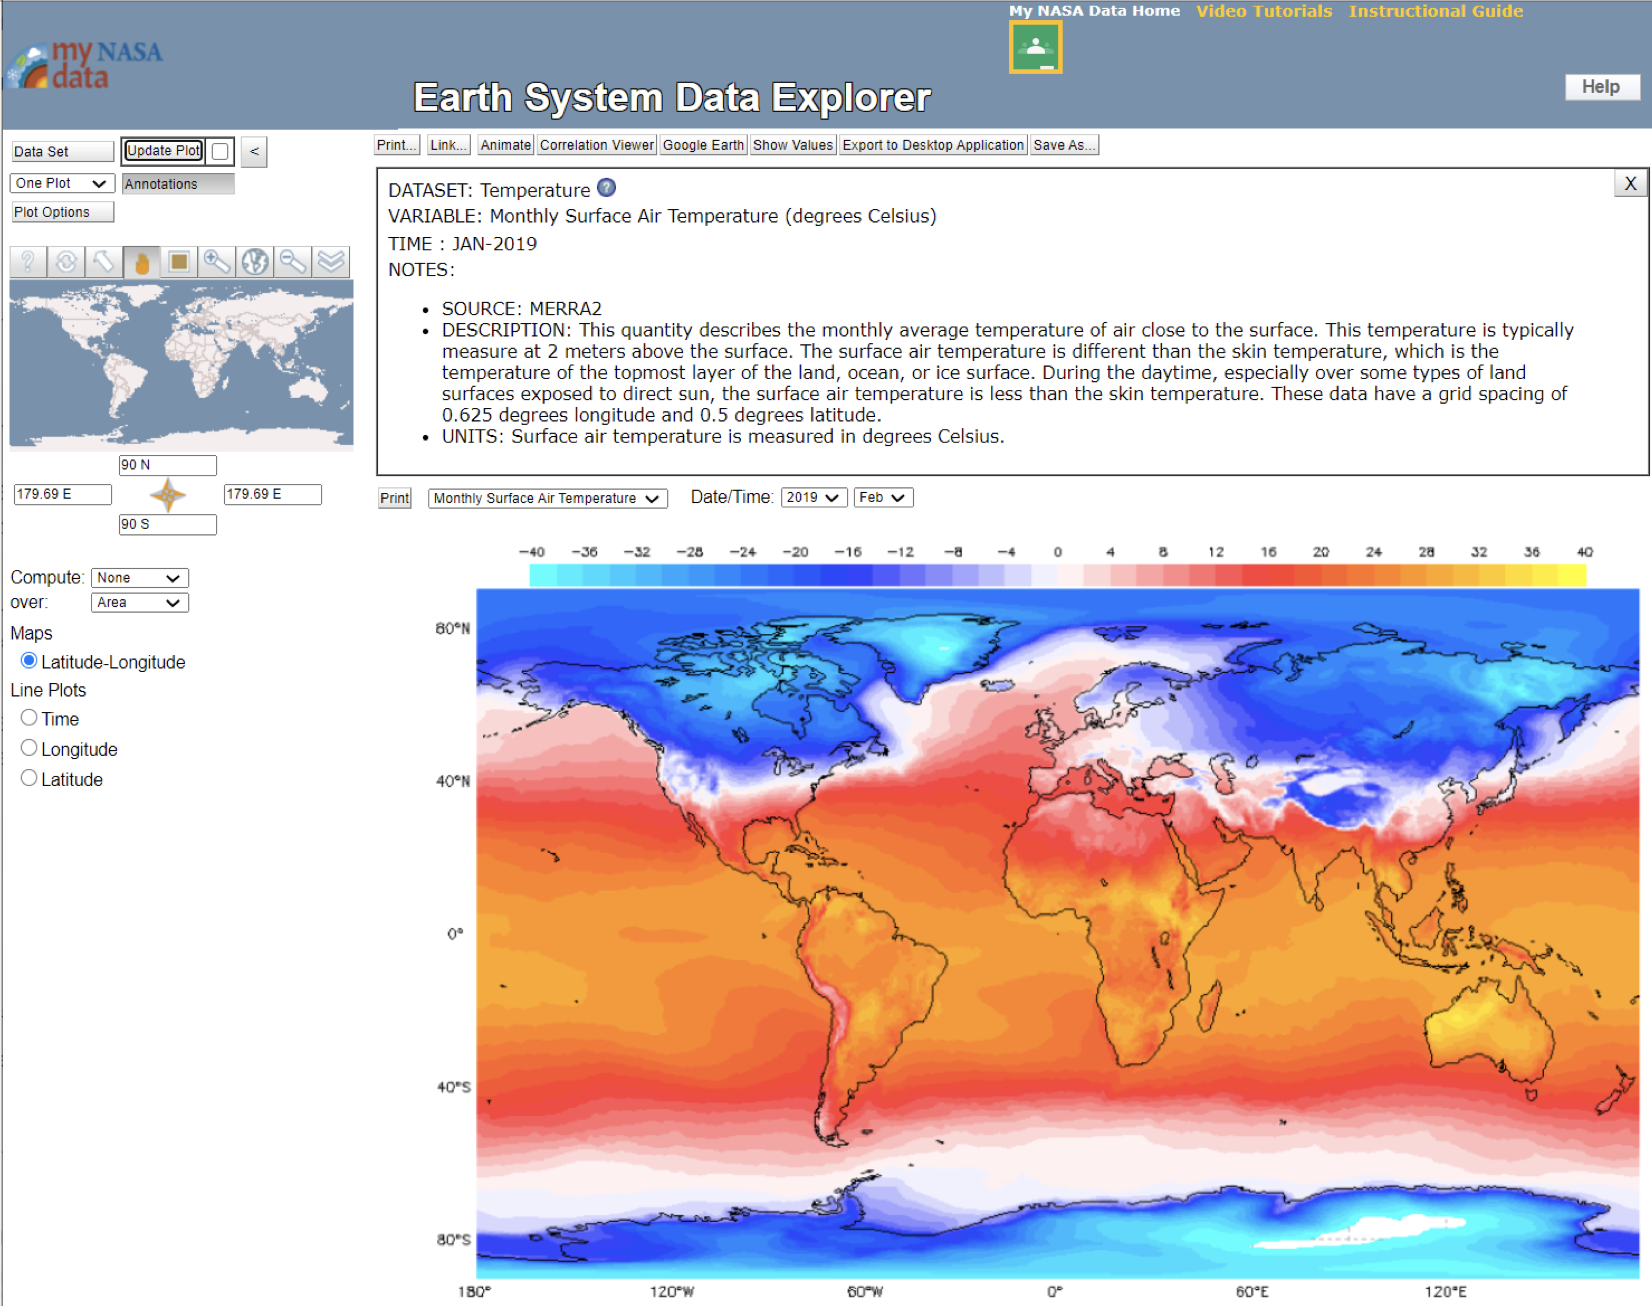
Data Visualization: Earth System Data Explorer
Link
Earth System Data Explorer is a visualization tool that allows users to interact with NASA Earth Science satellite data. This tool allows users to explore the data, create custom charts, graphs, and plots to help students visualize the data.
Related Resources
Check out the rationale for developing and supporting My NASA Data since its inception in 2004 and access the unique education products generated by the larger MND Team.