
Grade Level: 6-8,
9-12
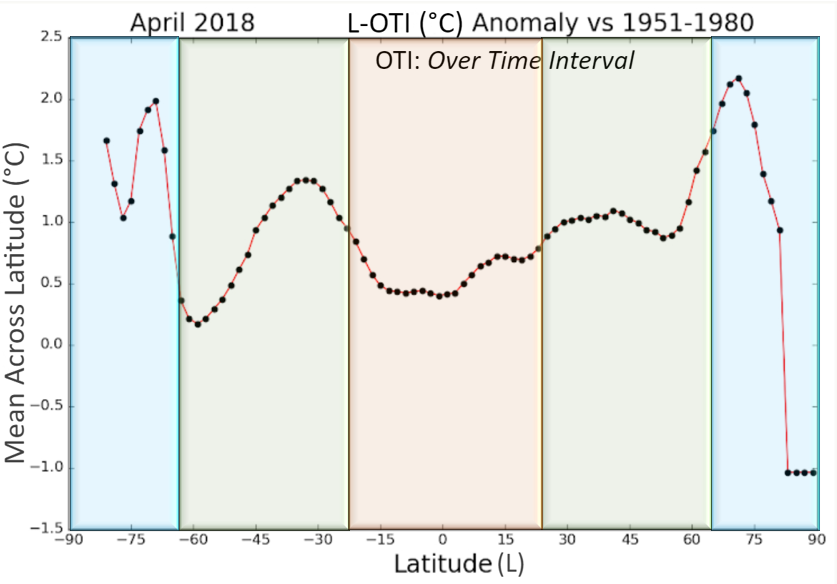
Students analyze surface air temperature anomalies to identify change with respect to different latitudes across the world.
Select a Sphere:


Students analyze surface air temperature anomalies to identify change with respect to different latitudes across the world.
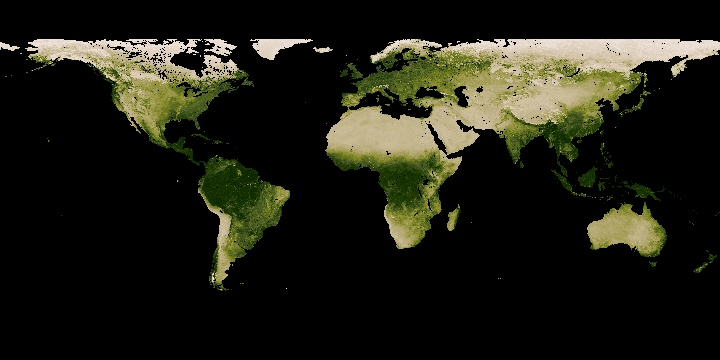
Students observe monthly images of changing vegetation patterns, looking for seasonal changes occurring throughout 2017. These data can be used by students to develop their own models of change.

This mini lesson provides a video on an ultra-high-resolution NASA computer model of how carbon dioxide in the atmosphere travels around the globe. Students will review the video and answer the following questions.
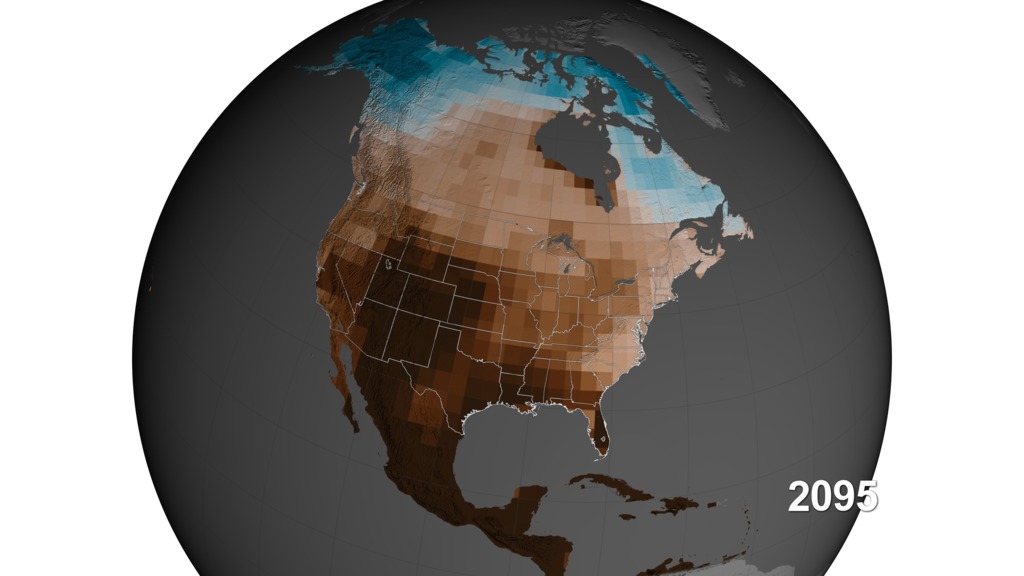
Students watch a visualization video and answer questions on the potential of increasing megadroughts in the southwest and central United States from 1950-2095 using models created by soil moisture data.

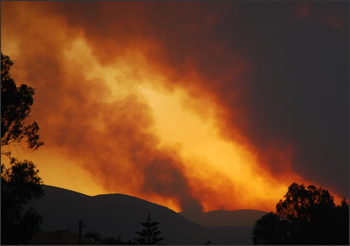
Students review a video that models the global impact of smoke from fires to develop an understanding of how models can be used to interpret and forecast phenomena in the Earth System.
Students explore the spatial patterns observed in meteorological data and learn how this information is used to predict weather and understand climate behavior.
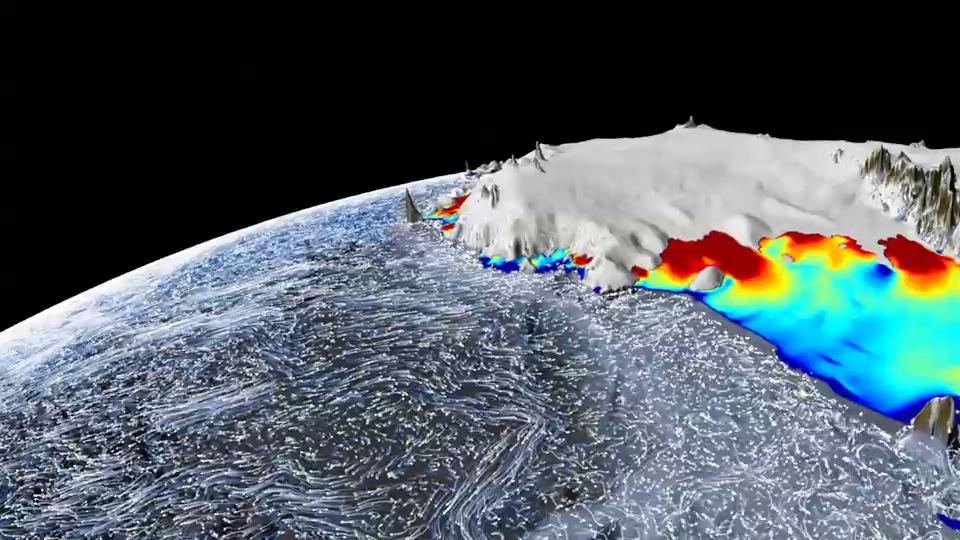
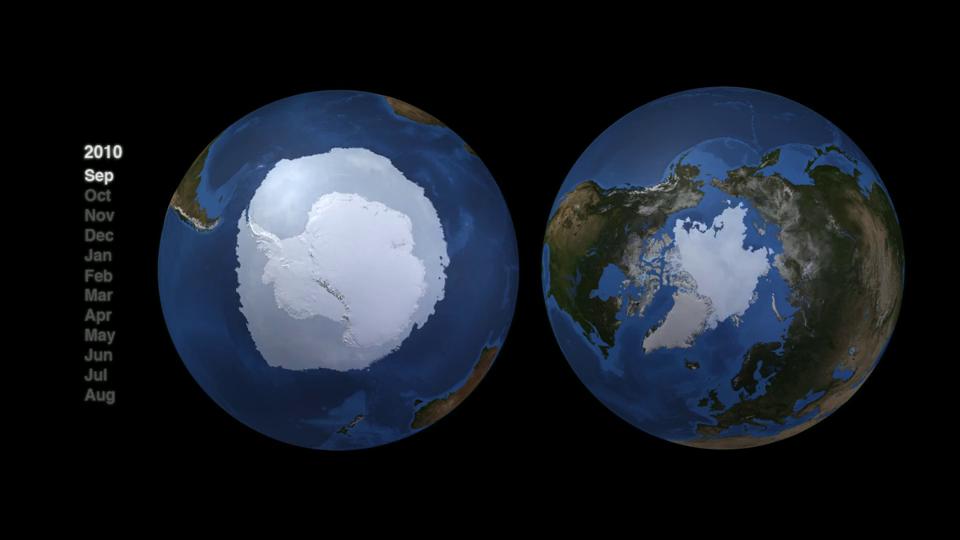
This mini lesson helps students visualize how the Hydrosphere and Cryosphere interact to produce changes in land and sea ice.
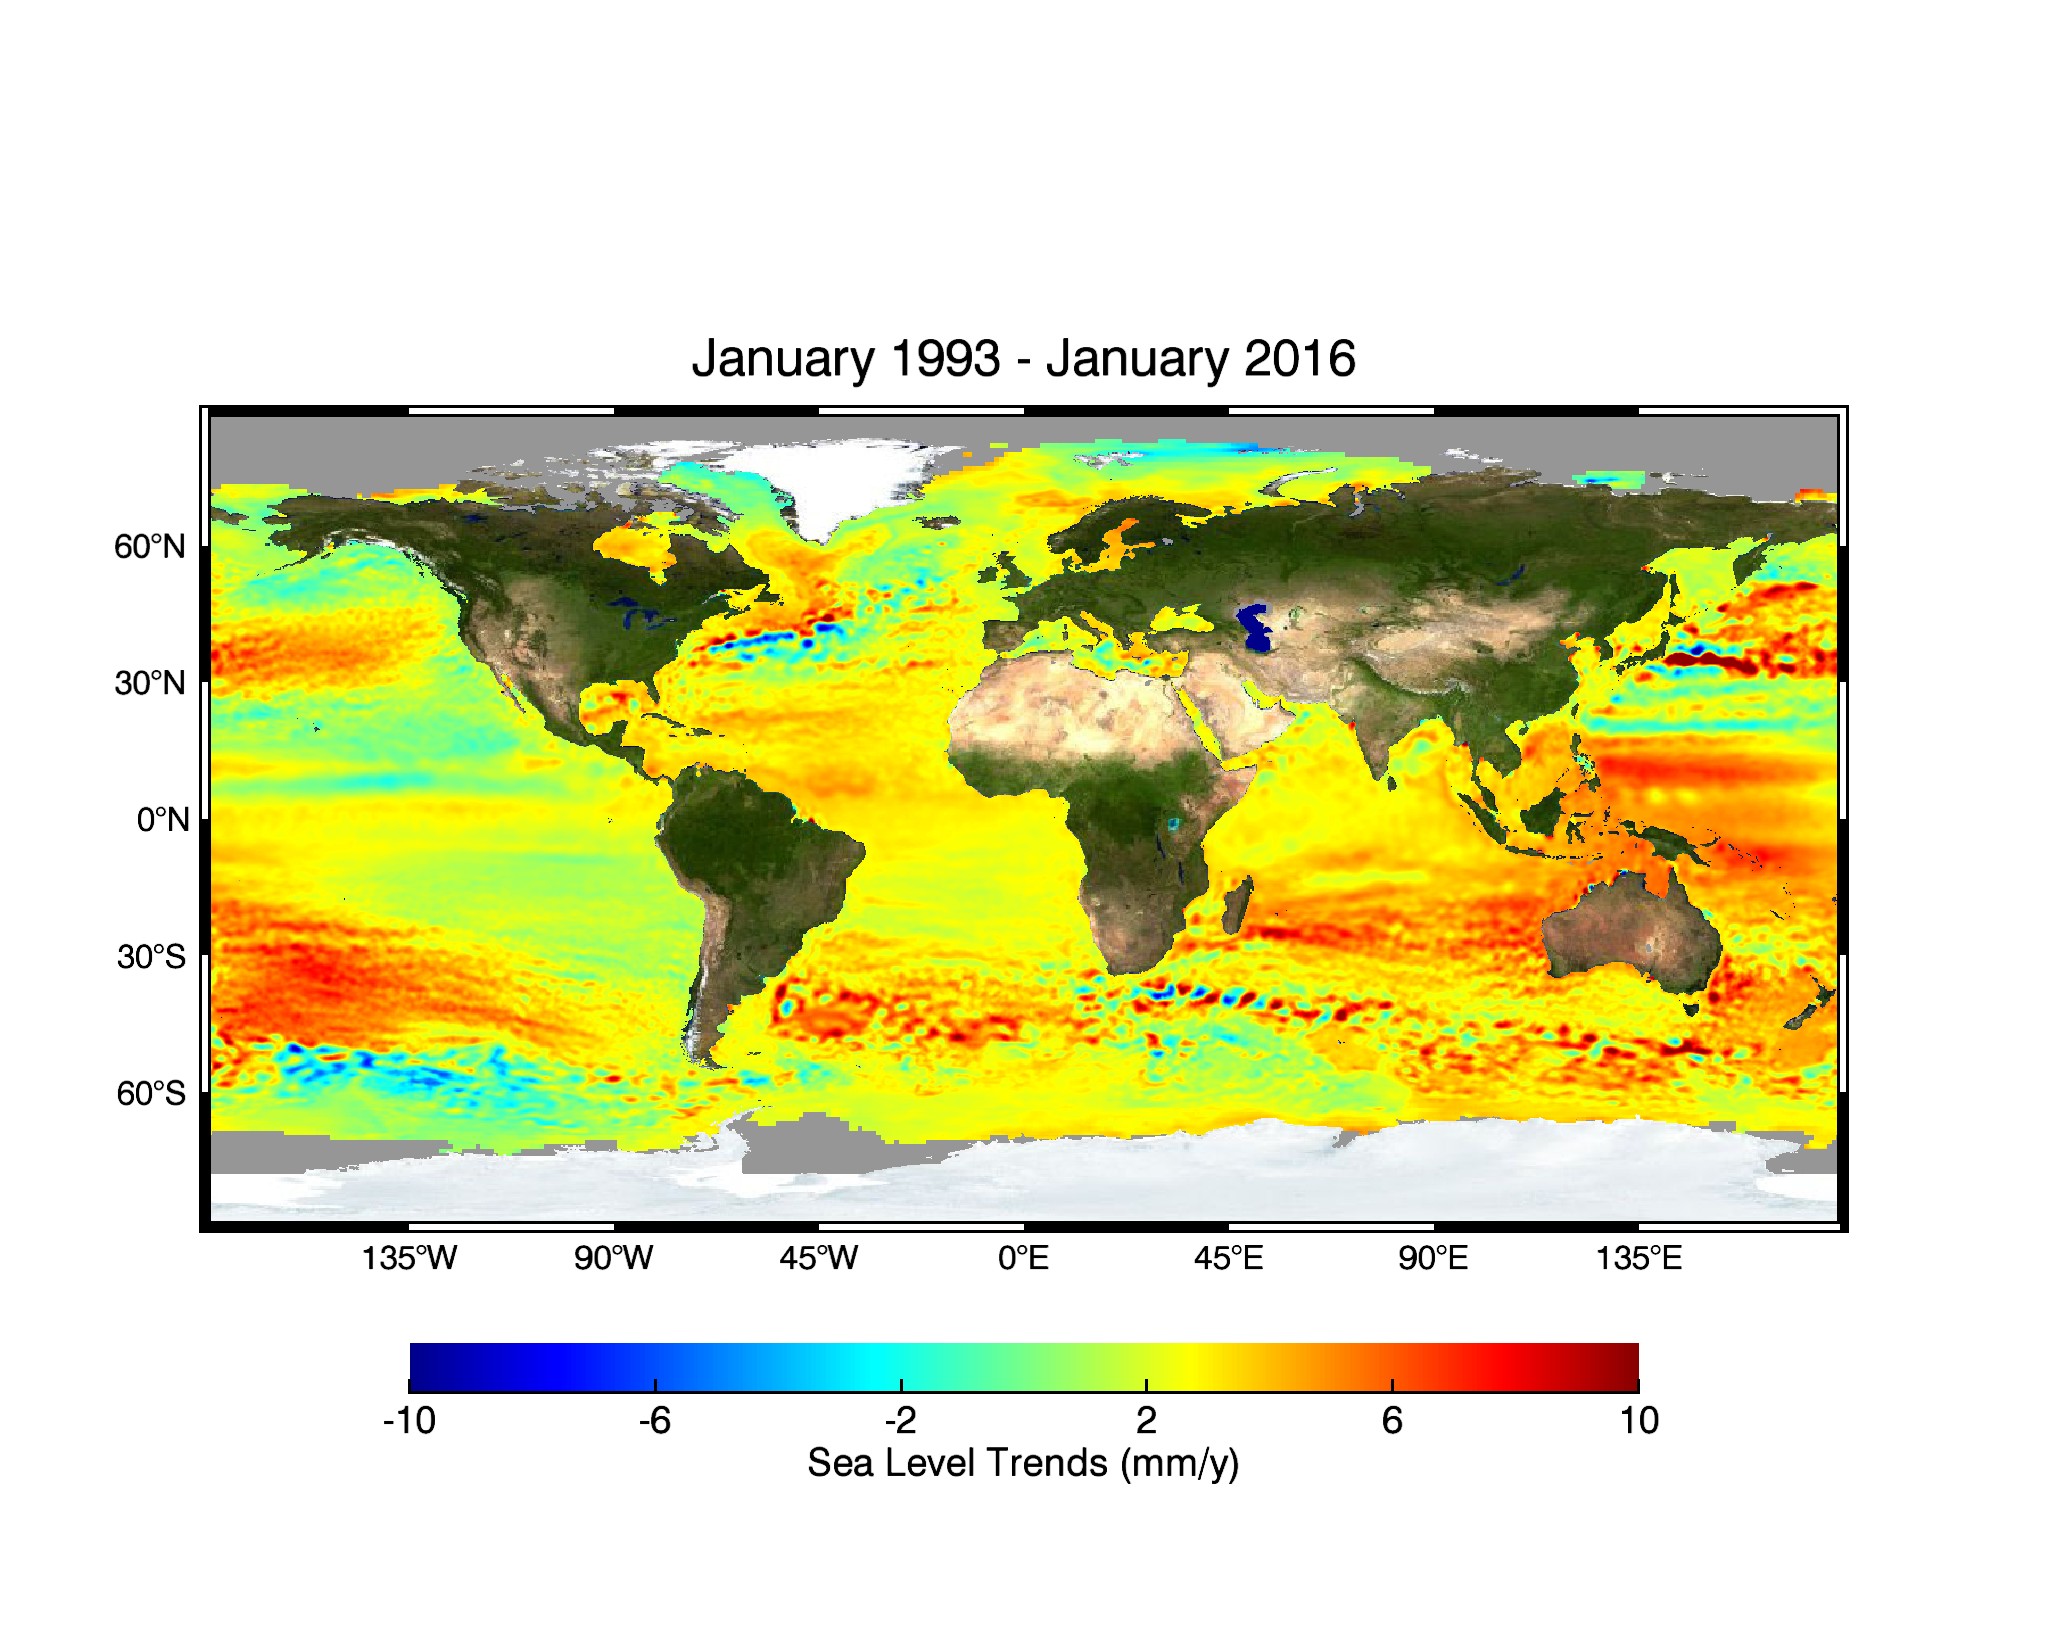
Students analyze four data visualizations focused on the topic of sea level. They use a jigsaw method to explore and communicate their findings to their peers.
The fires in Greece during the summer of 2007 devastated large tracks of forest and ground cover in this Mediterranean region. Students analyze these data to determine the scale, area, and percentage of the forest impacted by of these fires.
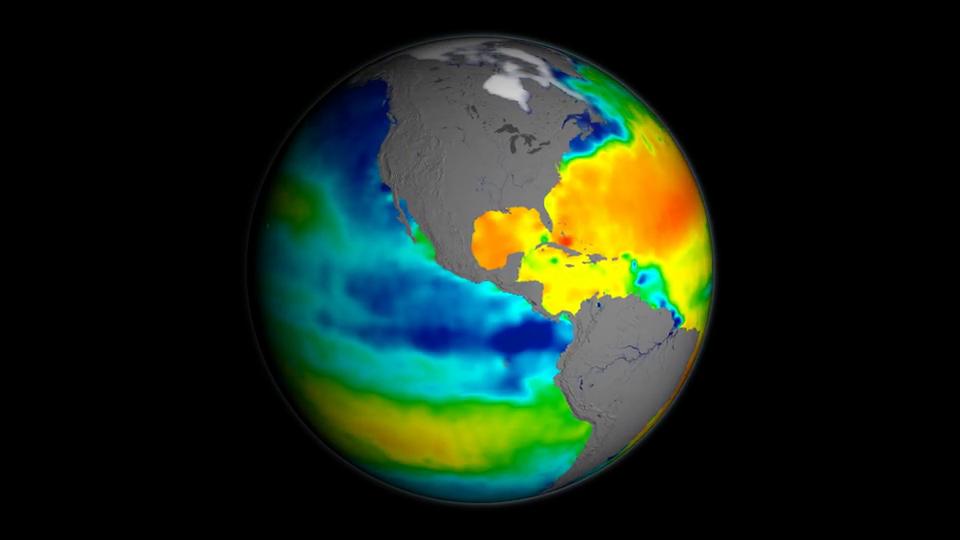
This NASA visualization shows sea surface salinity observations (September 2011-September 2014). Students review the video and answer questions.
Mini lessons are intended to be short engagement activities that teachers may assign as bell-ringers, exit slips, or parts of larger learning lessons. These include activities where students interact with NASA maps, graphs, and datasets from the atmosphere, biosphere, cryosphere, geosphere, hydrosphere and the earth system.
