
Grade Level: 6-8,
9-12
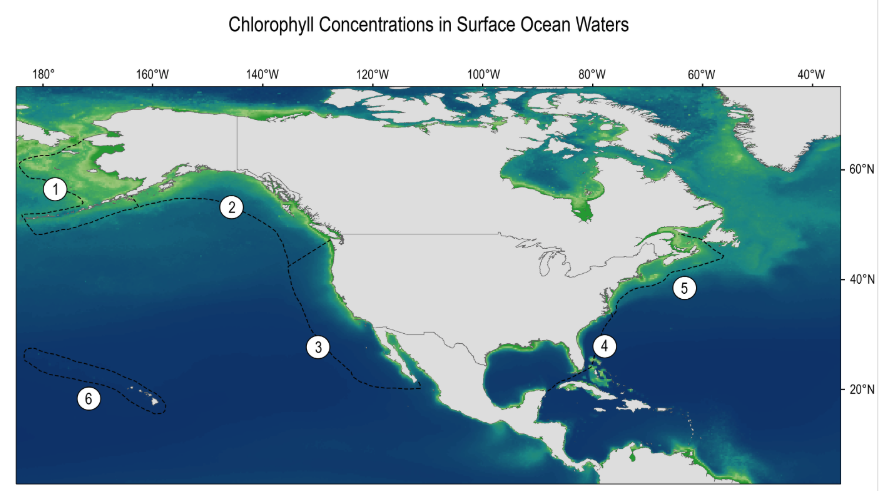
Students will analyze the mapped plot of the historic Ocean Chlorophyll Concentrations at key locations around the world for the period of 1998-2018.
Select a Sphere:


Students will analyze the mapped plot of the historic Ocean Chlorophyll Concentrations at key locations around the world for the period of 1998-2018.
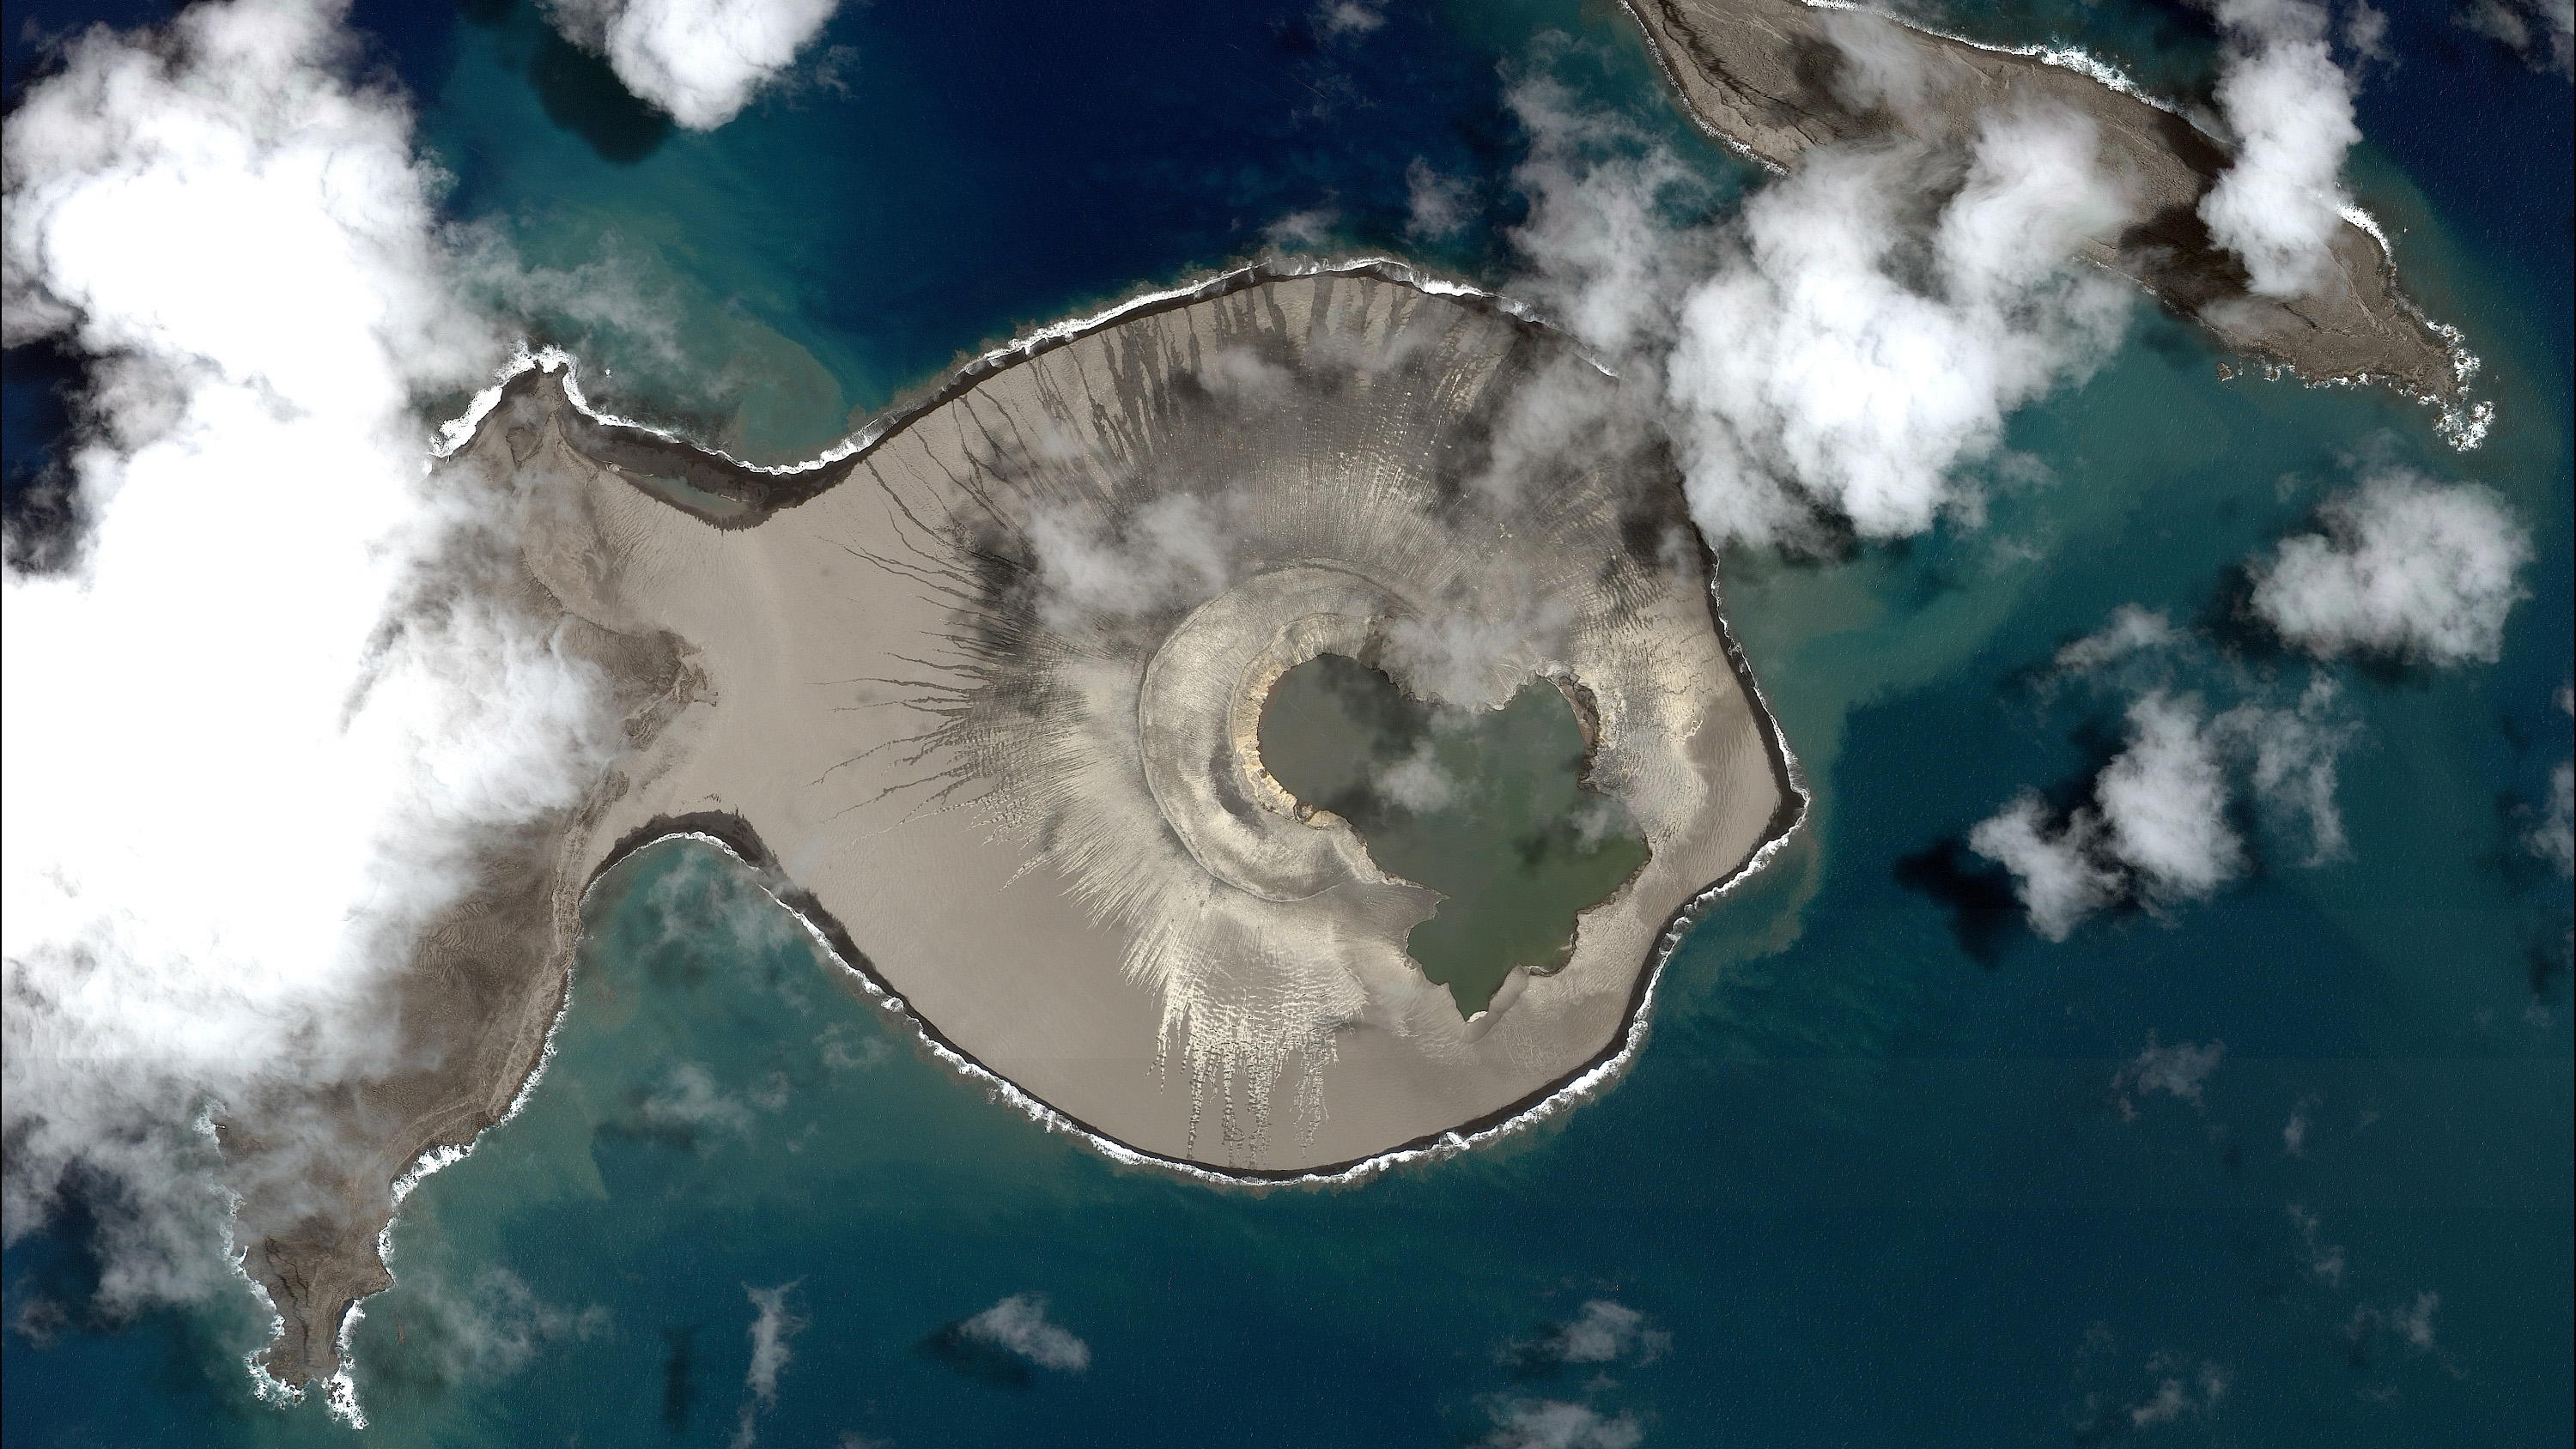
Students will describe the changes in a newly-formed volcanic island over the first three years of its life.
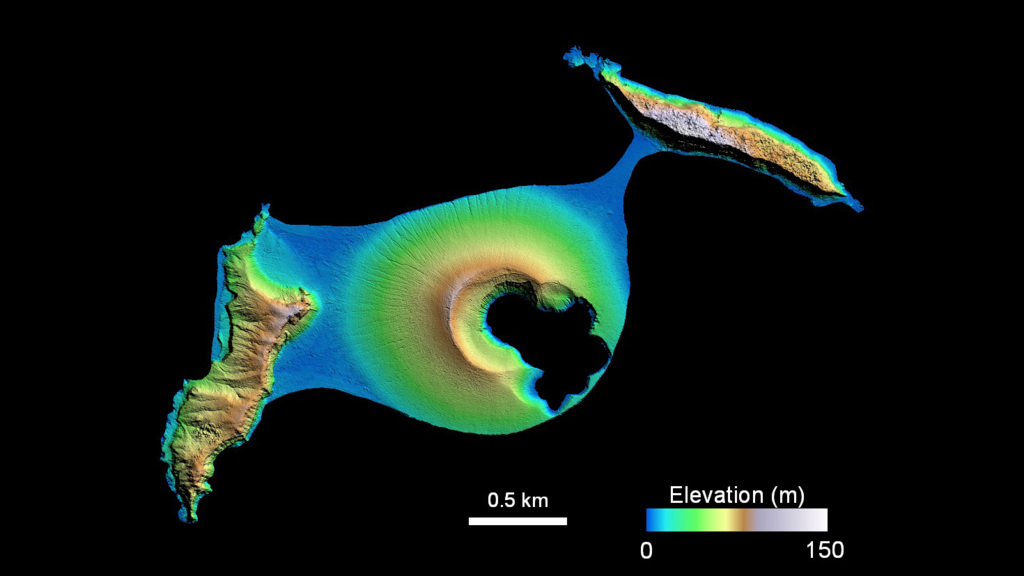
Students examine satellite images of a recently formed island to identify areas of erosion and deposition.
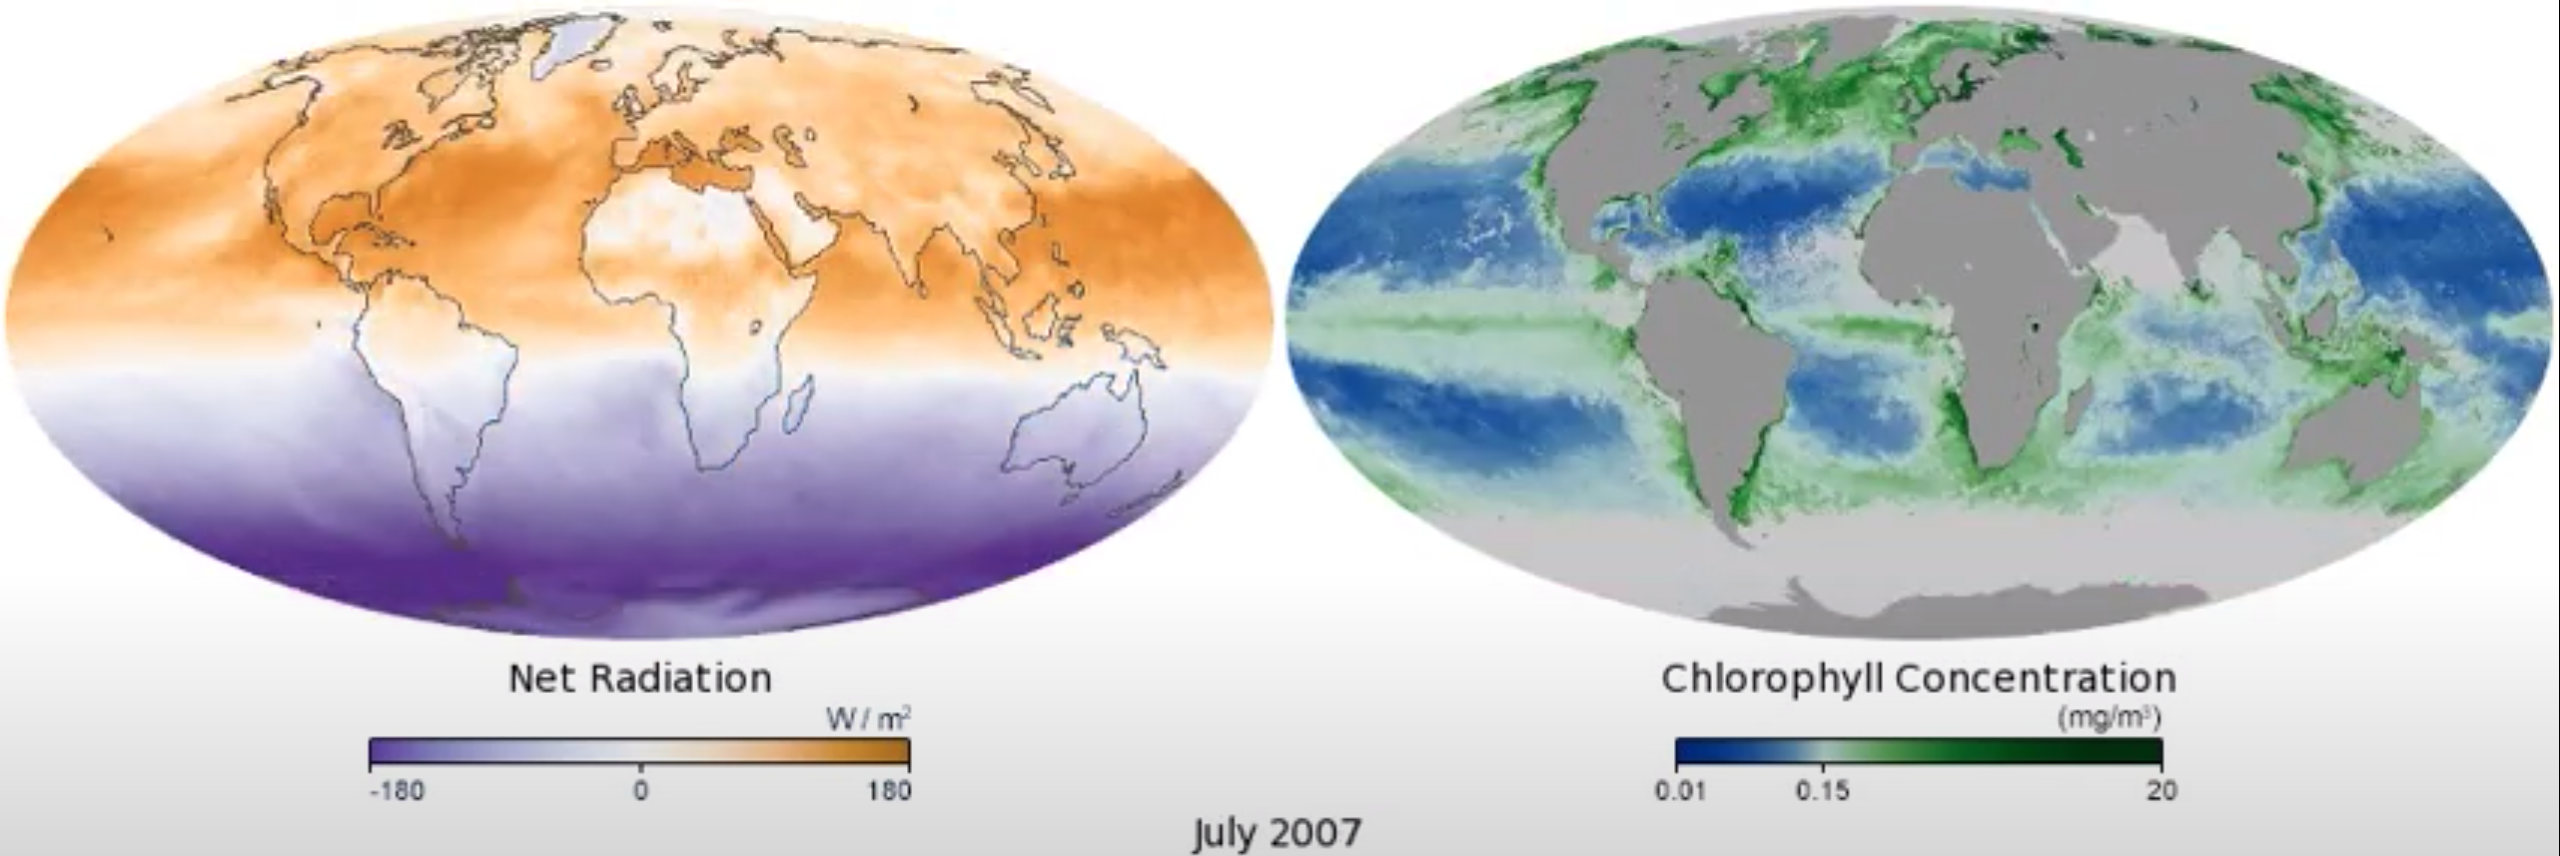
This mini lesson engages students by watching a NASA video related to seasonal chlorophyll concentration as it relates to net radiation using NASA's Aqua satellite. Students will examine the model and answer the questions.
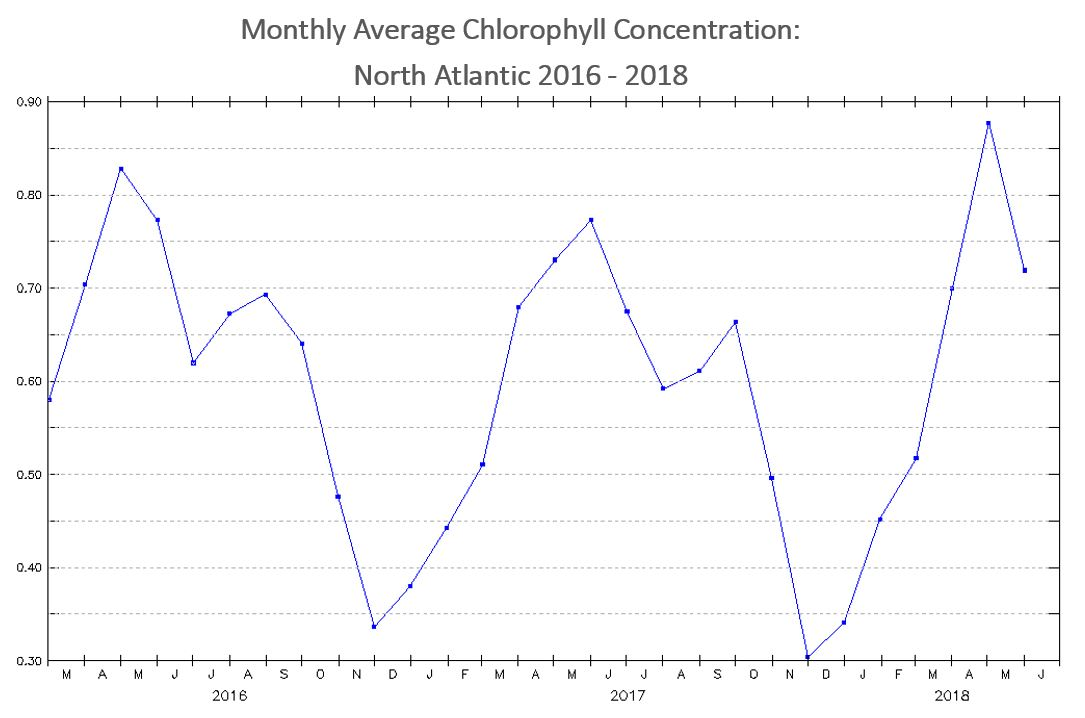
In this mini lesson, students explore the relationship of chlorophyll and solar radiation by analyzing line graphs from the North Atlantic during 2016-2018.
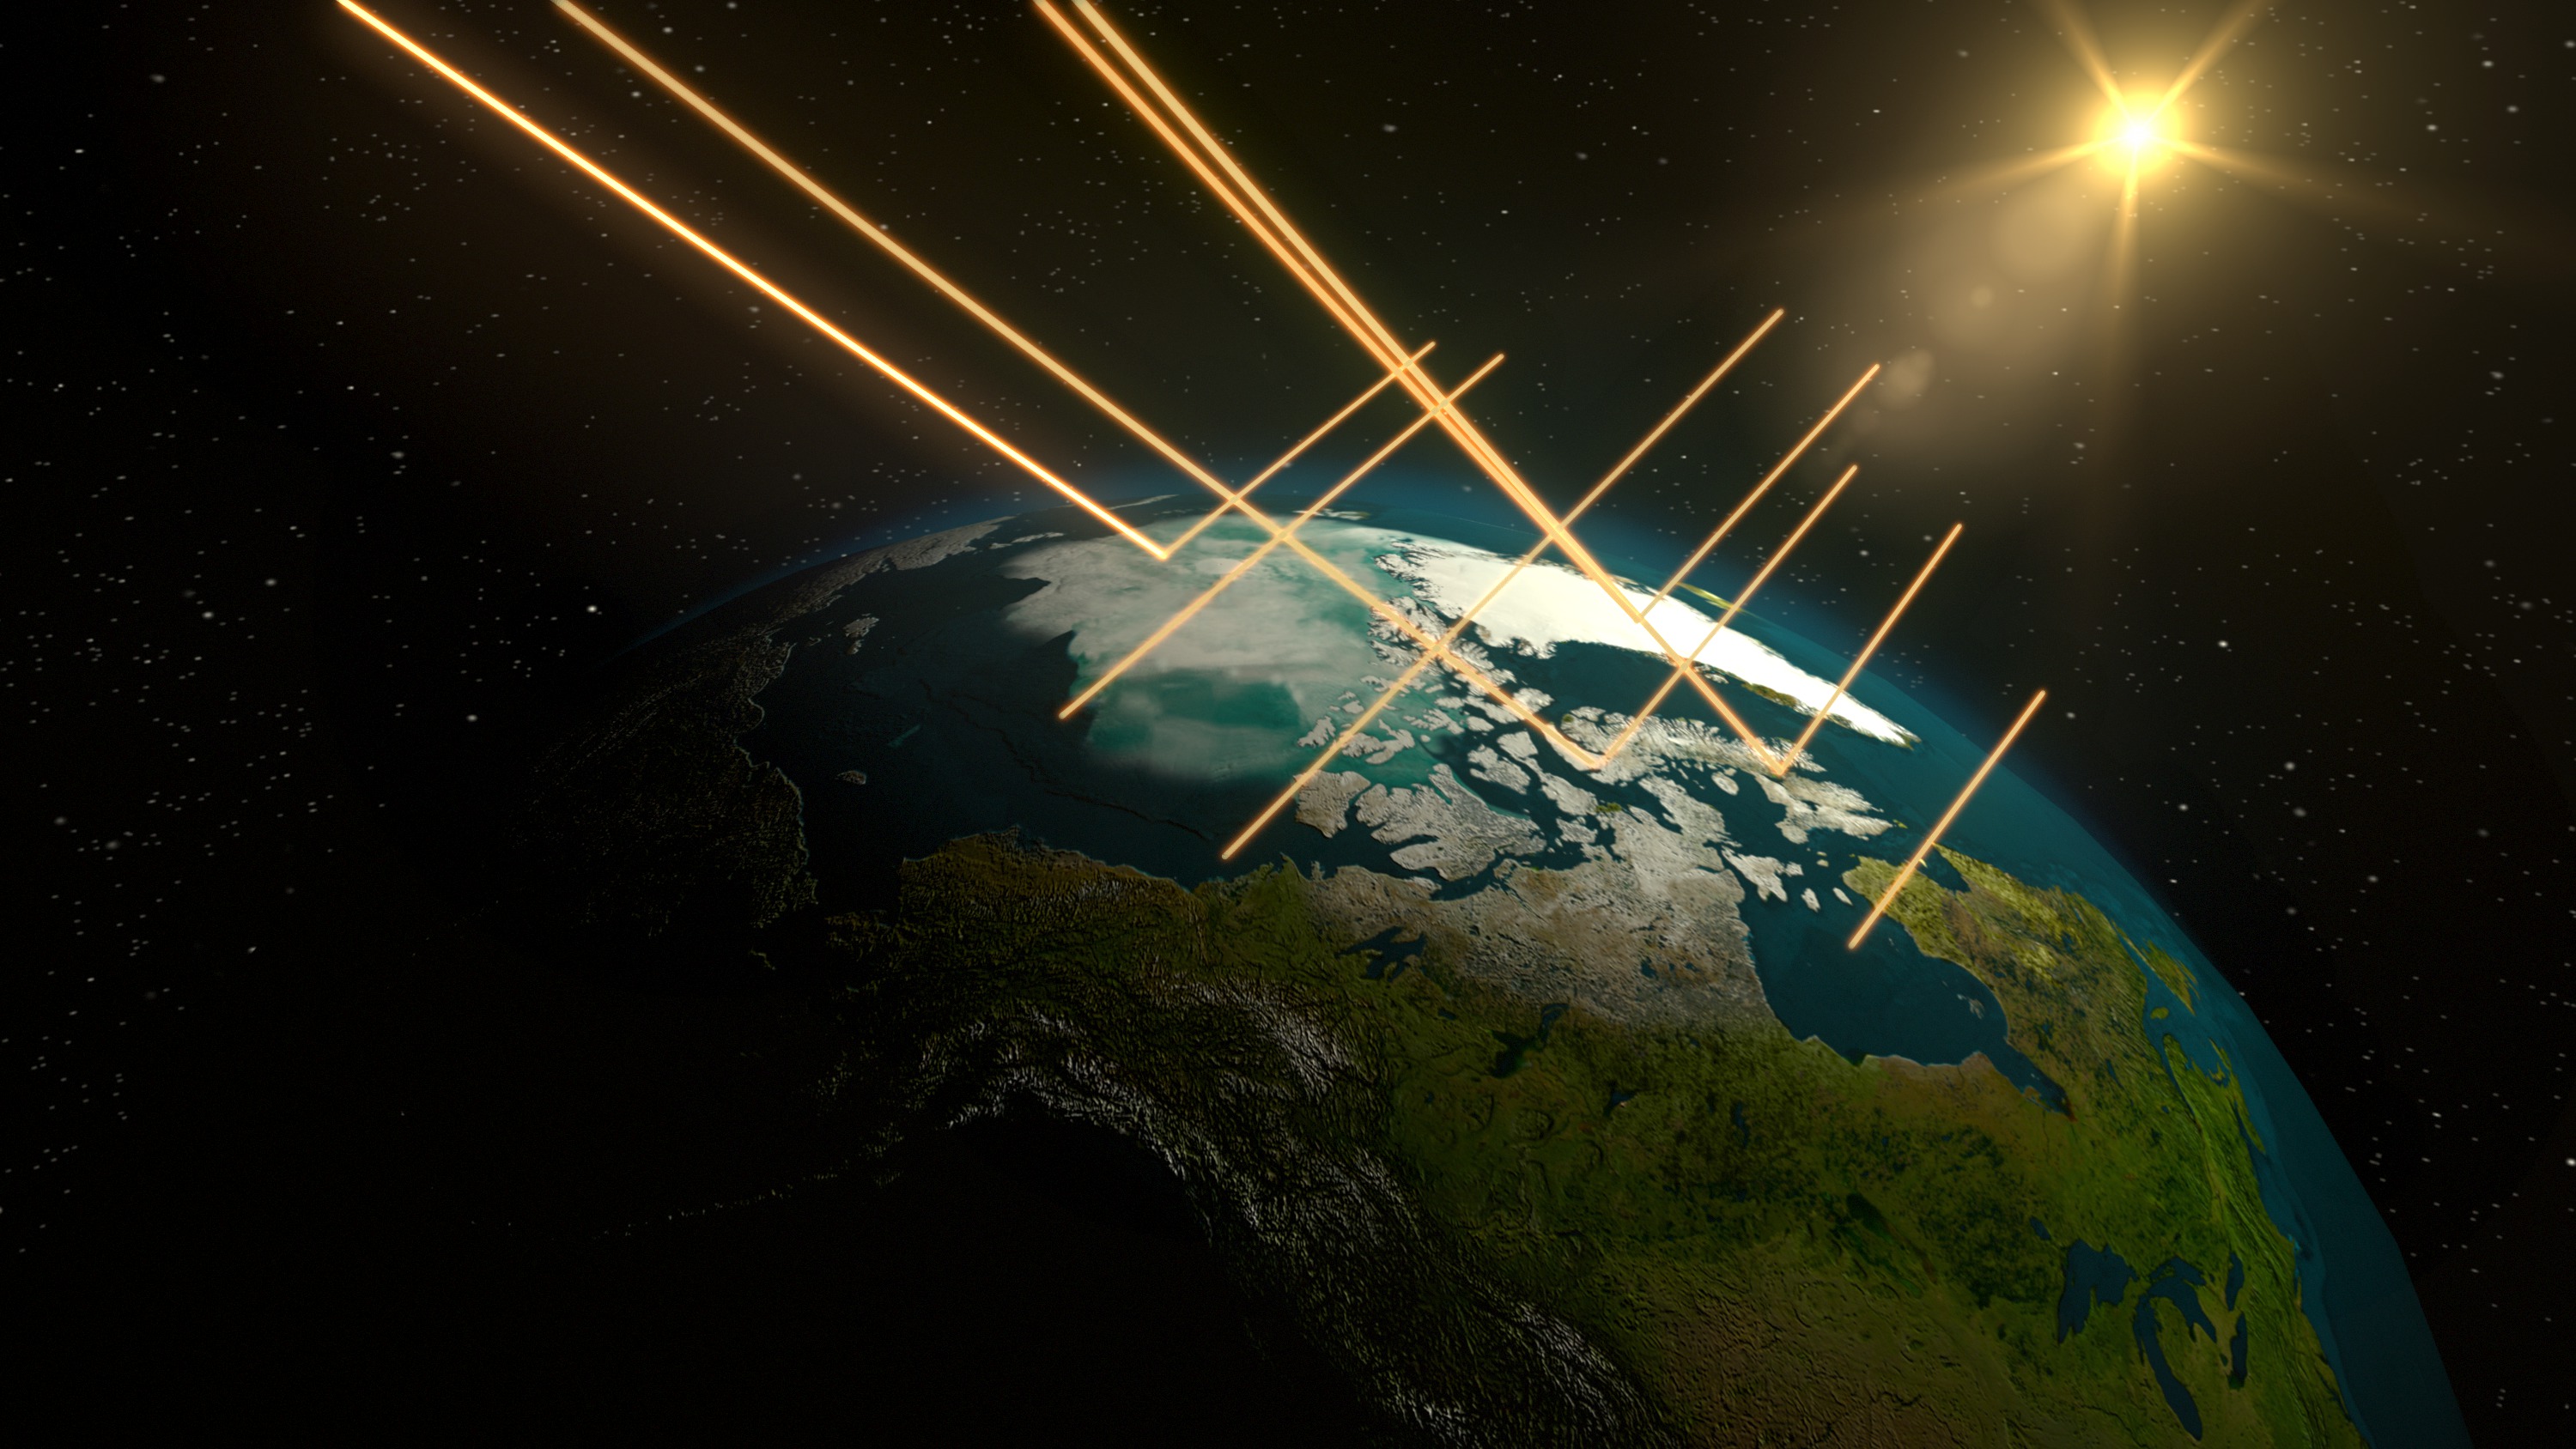
Students watch a video introducing the concept of albedo and answer questions.
Help learners envision themselves as explorers, scientists, technologists, engineers, and mathematicians as they venture into the summer months. Download the PDF of the two sided document on cardstock and have students imagine and illustrate themselves!
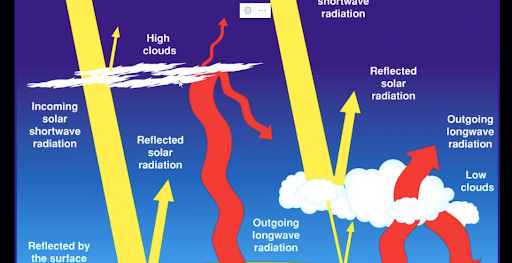
Students analyze diagrams showing the effects of clouds on Earth’s Radiation and answer the questions that follow. This mini lesson is designed to help students analyze the interaction between clouds and Earth's incoming and outgoing energy.
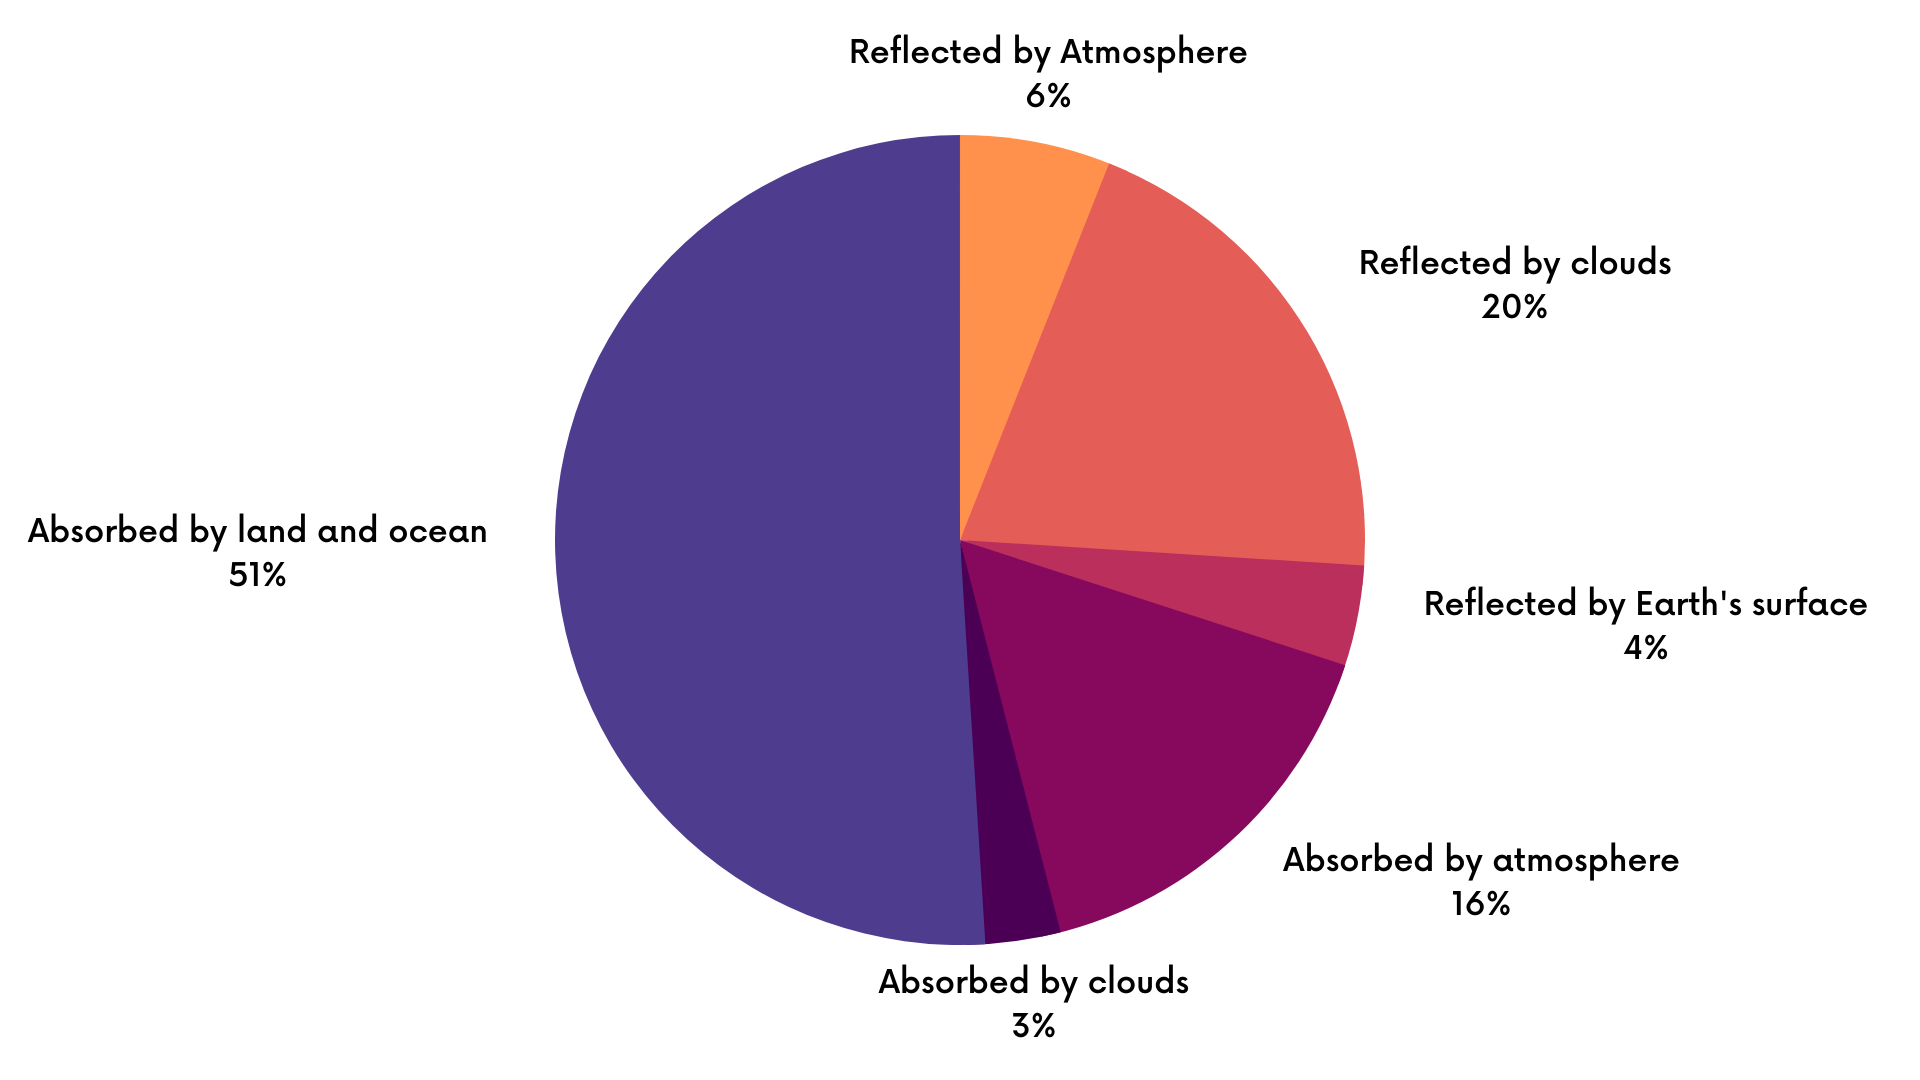
Students will analyze a pie chart (circle graph) showing the distribution of different parts of the Earth system's absorption and reflection of energy.
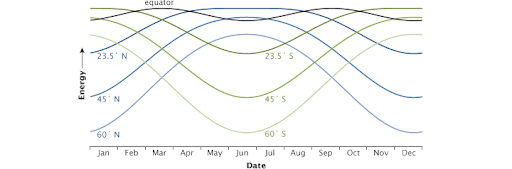
Students will analyze a graph showing the amounts of peak energy received at local noon each day over the year changes with different latitudes.
Mini lessons are intended to be short engagement activities that teachers may assign as bell-ringers, exit slips, or parts of larger learning lessons. These include activities where students interact with NASA maps, graphs, and datasets from the atmosphere, biosphere, cryosphere, geosphere, hydrosphere and the earth system.
