
Grade Level: 6-8,
9-12
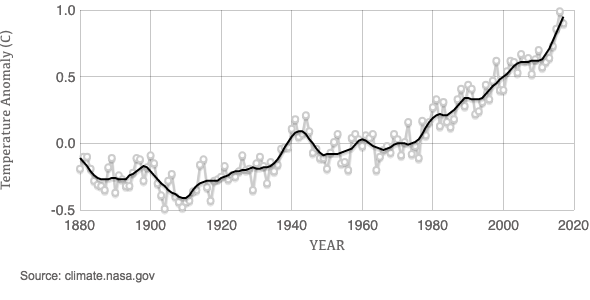
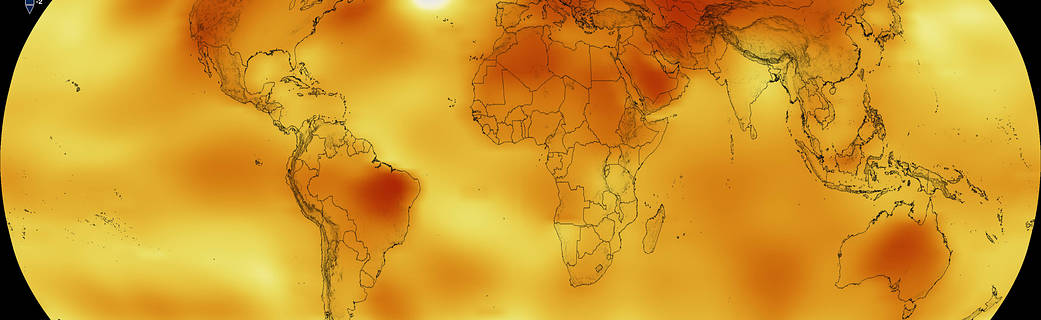
Students analyze a graph that illustrates the change in global surface temperature relative to 1951-1980 average temperatures.
Select a Sphere:


Students analyze a graph that illustrates the change in global surface temperature relative to 1951-1980 average temperatures.
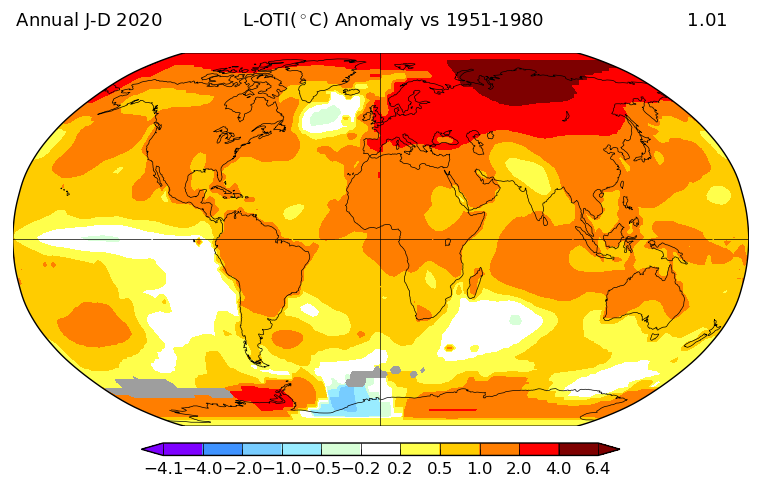
Students observe the map image, individually, looking for changes in surface air temperatures (using data displayed, unit of measure, range of values, etc.) and noticeable patterns.
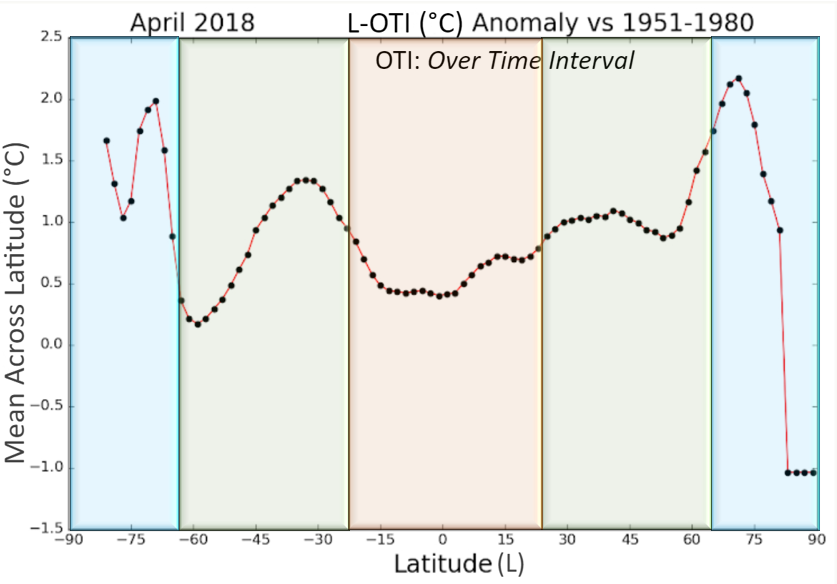
Students analyze surface air temperature anomalies to identify change with respect to different latitudes across the world.

This mini lesson provides a video on an ultra-high-resolution NASA computer model of how carbon dioxide in the atmosphere travels around the globe. Students will review the video and answer the following questions.
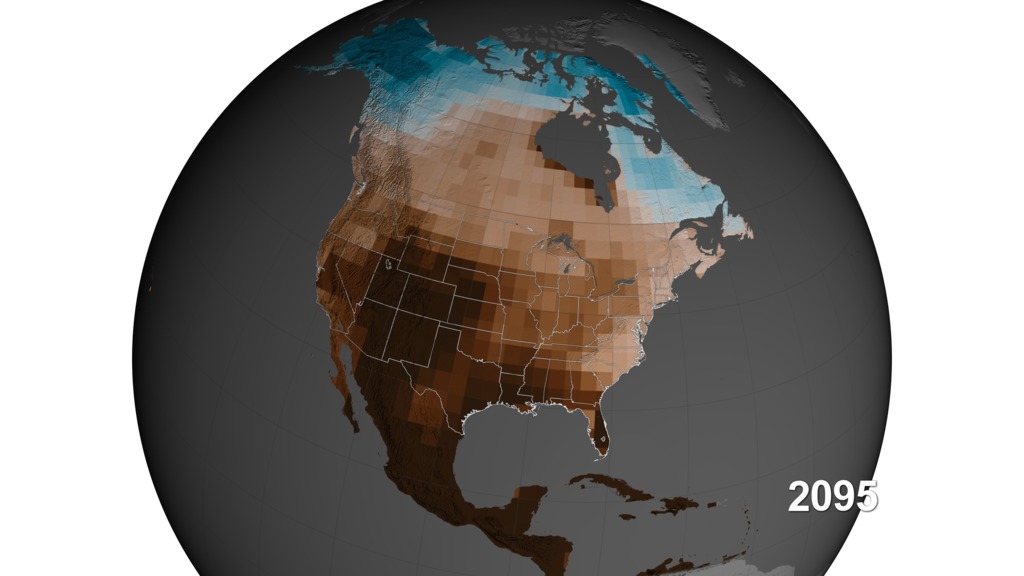
Students watch a visualization video and answer questions on the potential of increasing megadroughts in the southwest and central United States from 1950-2095 using models created by soil moisture data.

Students review a video that models the global impact of smoke from fires to develop an understanding of how models can be used to interpret and forecast phenomena in the Earth System.
This mini lesson engages students in writing a commentary for a NASA video regarding changes in global temperatures from 1880 to 2017.

In this mini-lesson, students analyze soil moisture quantities associated with Hurricane Harvey around Houston, Texas on August 25, 2017.
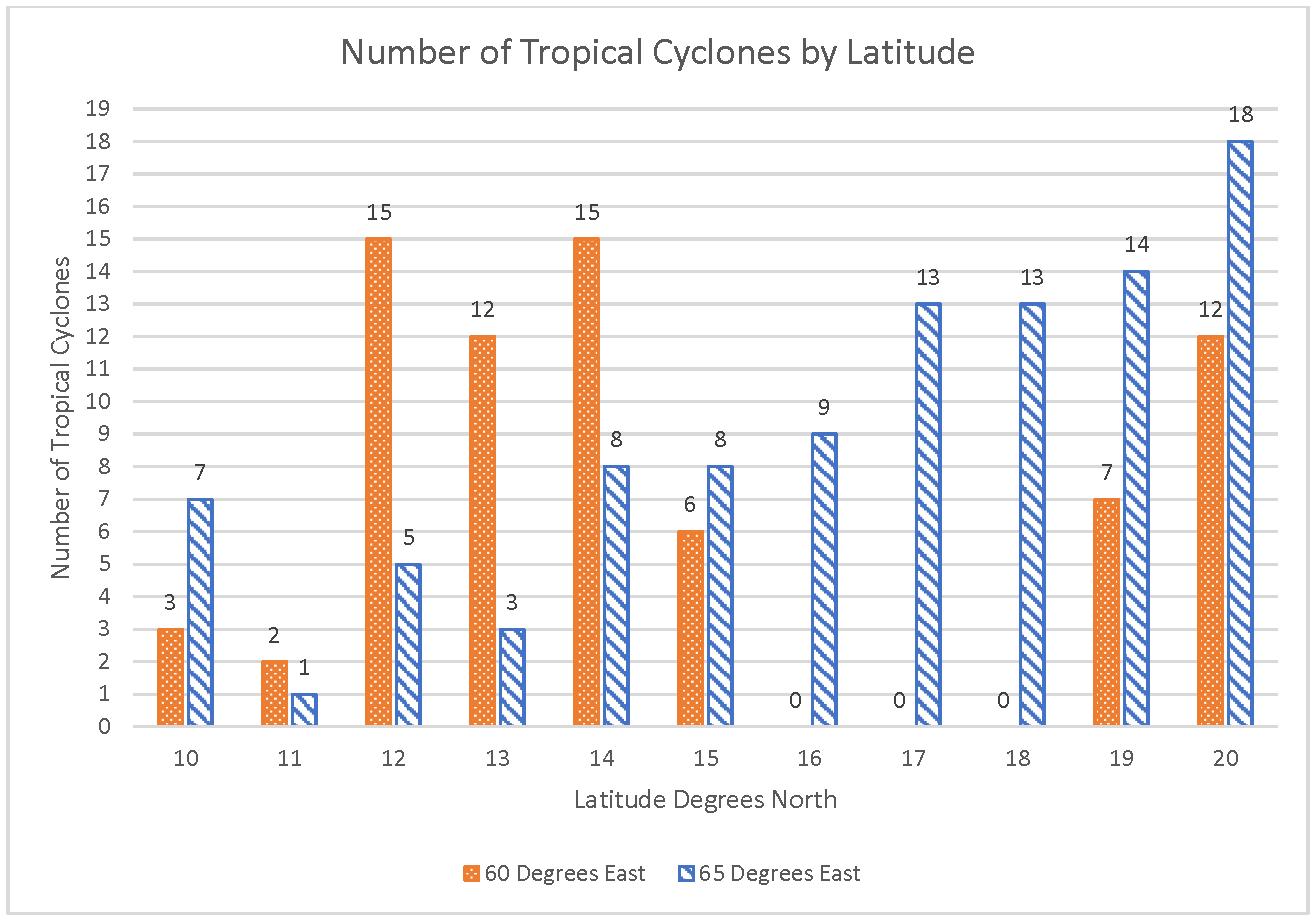
Students interpret a double bar/column chart comparing the number of tropical cyclones in different locations.
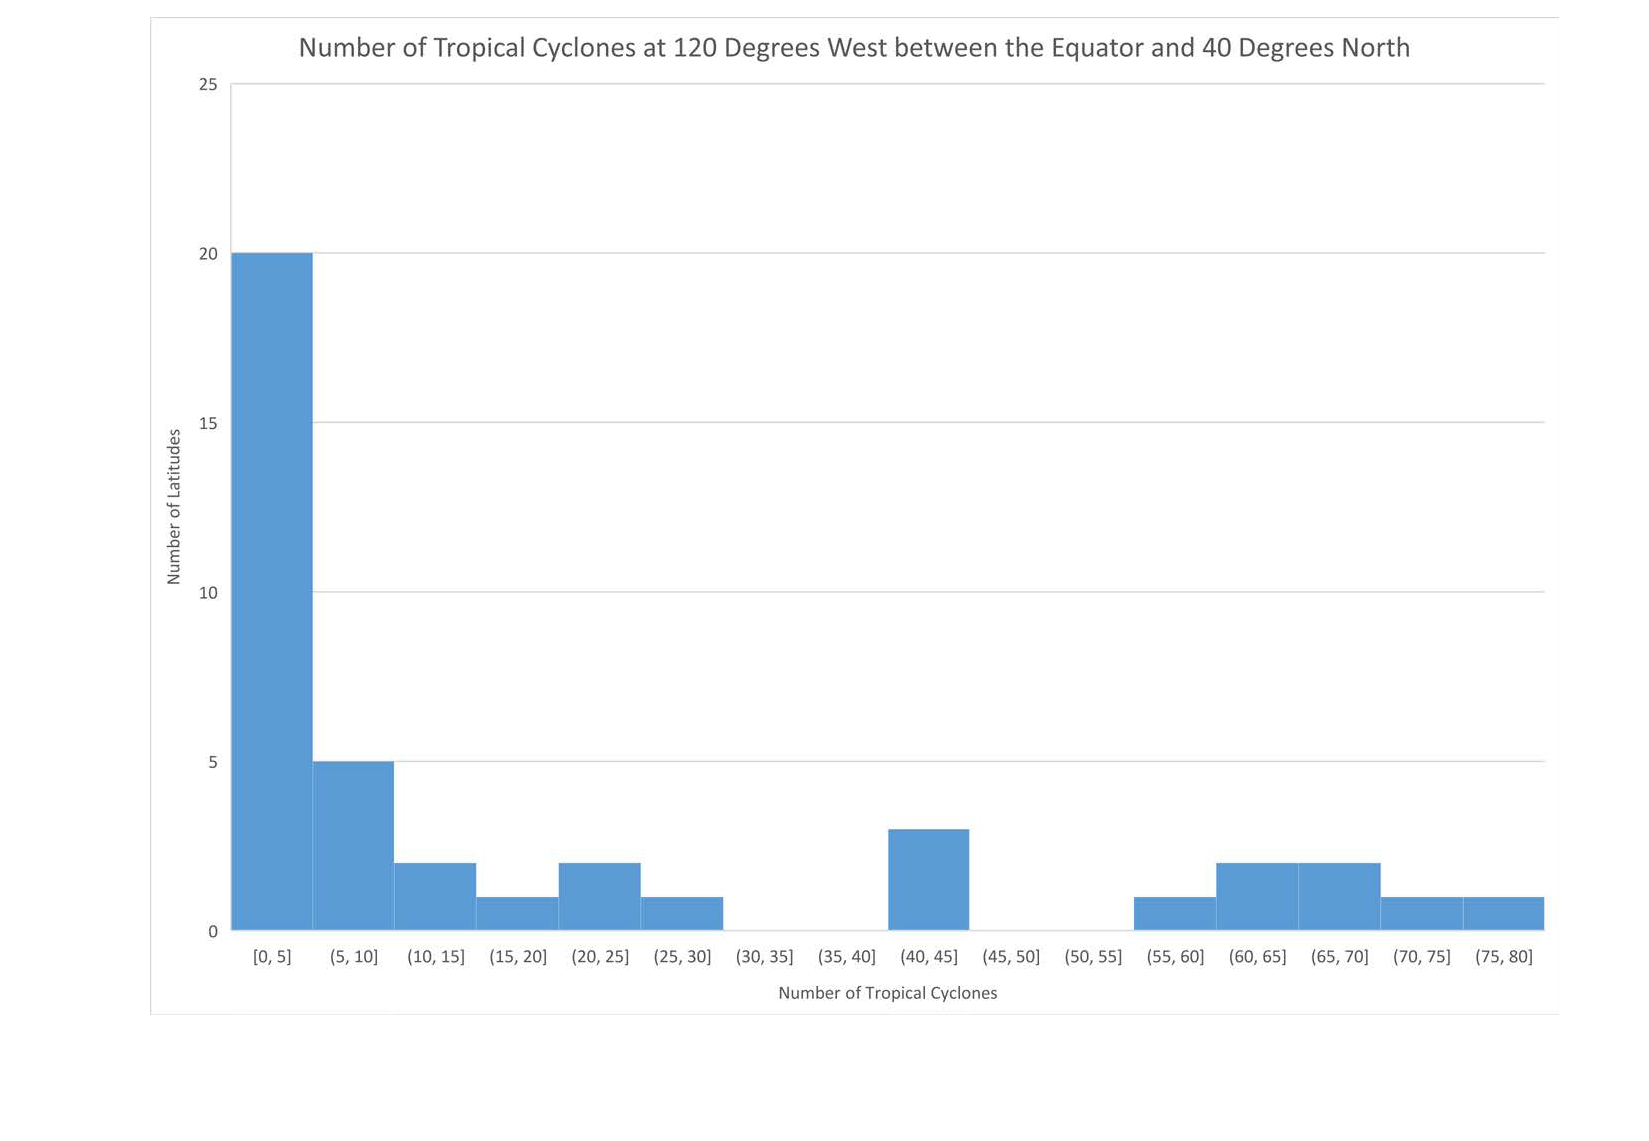
Compare a histogram and map to determine the differences in the information conveyed in each data display.
Mini lessons are intended to be short engagement activities that teachers may assign as bell-ringers, exit slips, or parts of larger learning lessons. These include activities where students interact with NASA maps, graphs, and datasets from the atmosphere, biosphere, cryosphere, geosphere, hydrosphere and the earth system.

