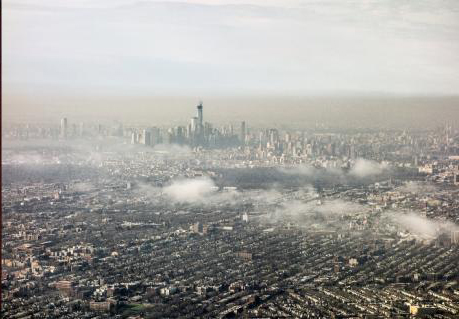
Students will synthesize information from maps that show population, concentrations of PM2.5, and PM2.5-attributable mortality across the globe in order to draw conclusions about the relationship between particulate pollution and human health.
List of all Atmosphere Mini Lessons


Grade Level: 9-12
Grade Level: 6-8,
9-12
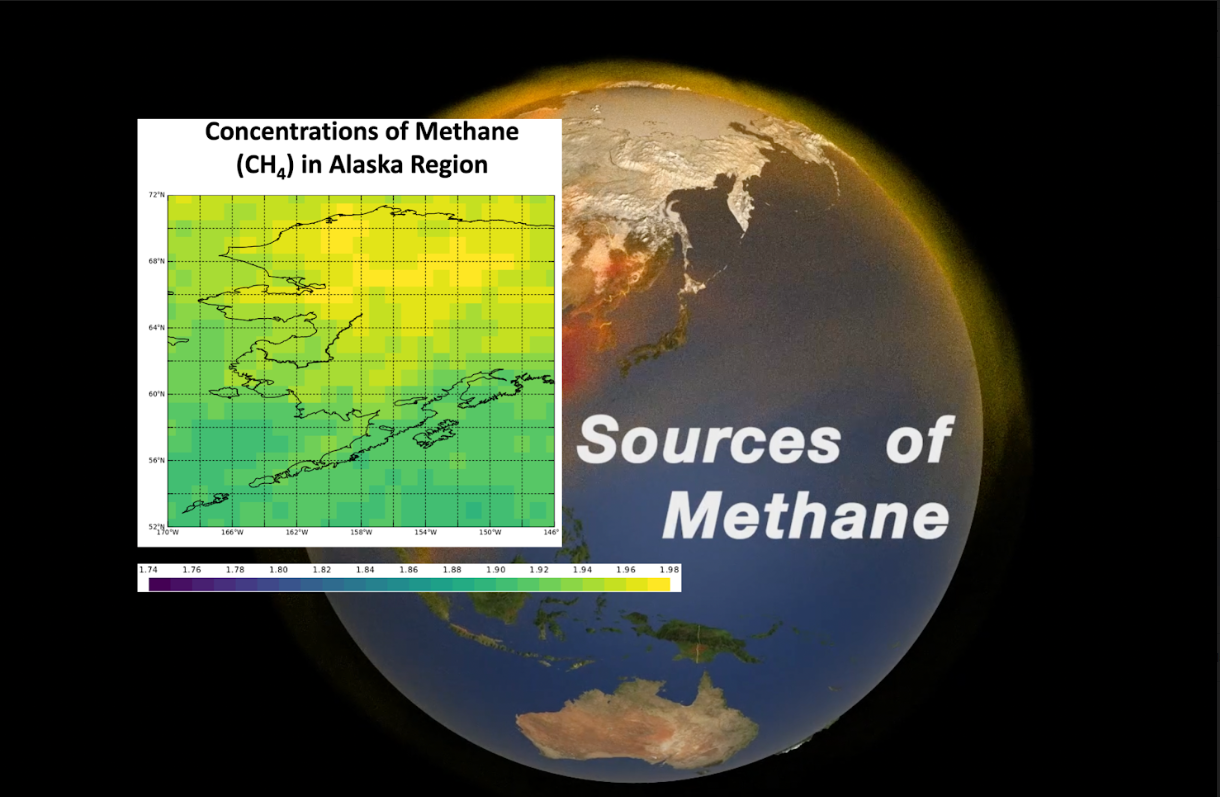
Students watch a short video to gather information about sources of methane emissions and then extend their understanding of these sources to evaluate monthly trends in the Alaska region, ultimately making connections to Earth’s energy budget.
Grade Level: 6-8,
9-12
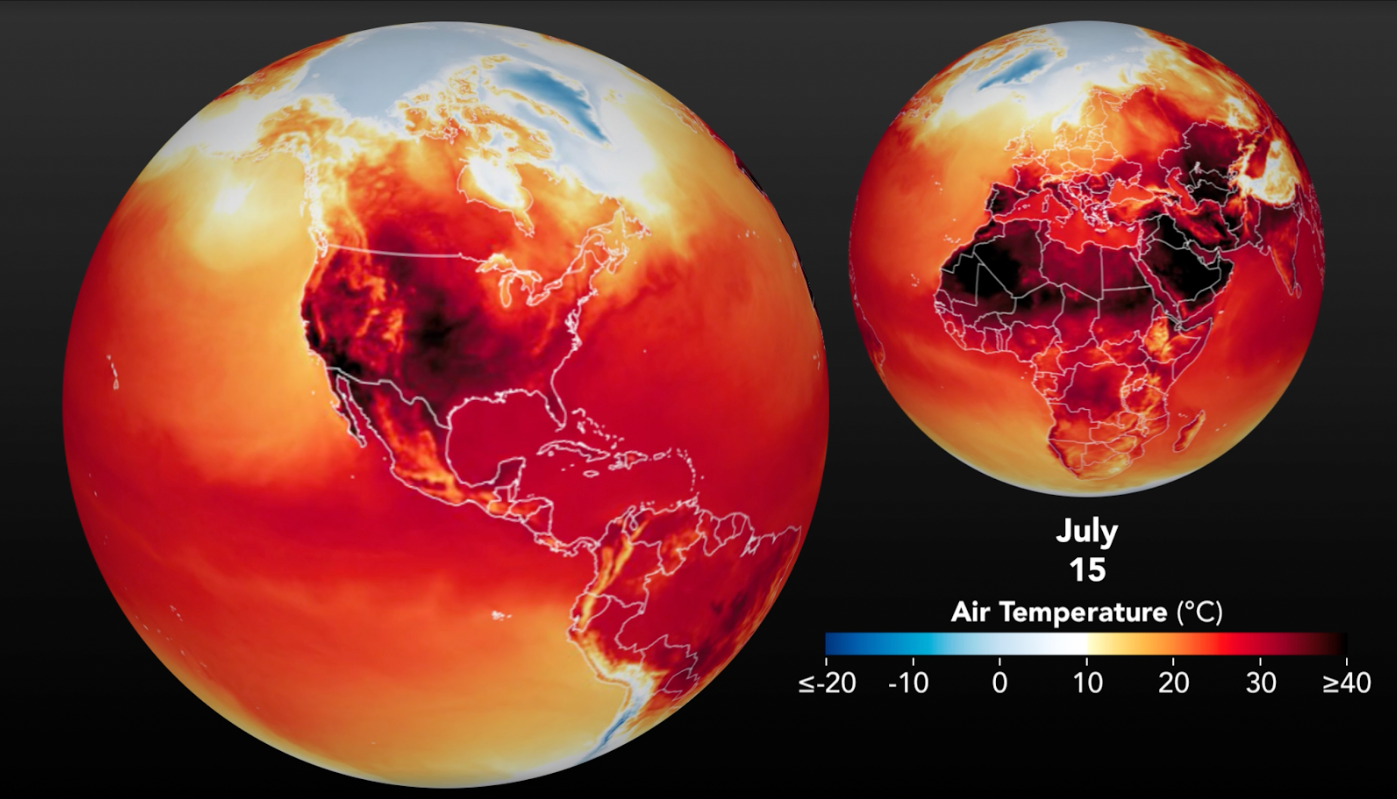
By investigating the data presented in a model that displays extreme summer air temperatures, students explain energy transfer in the Earth system and consider the impact of excessive heat on local communities.


