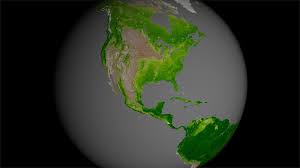
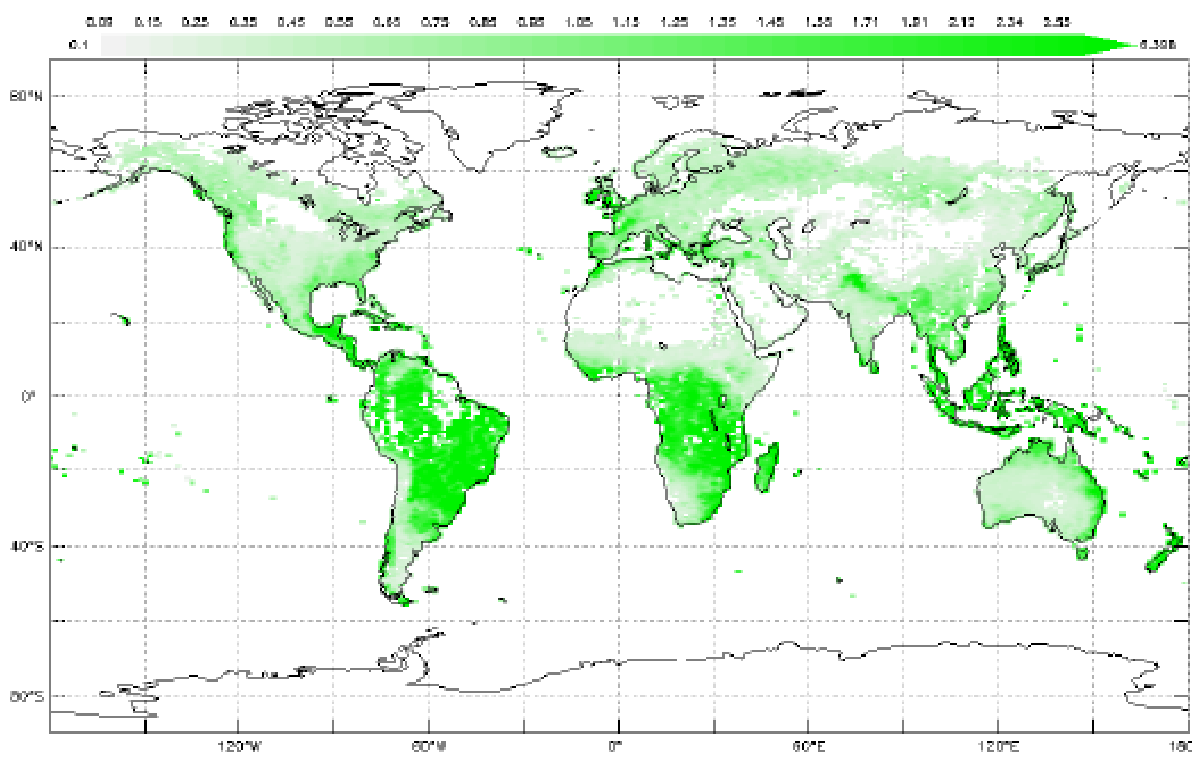
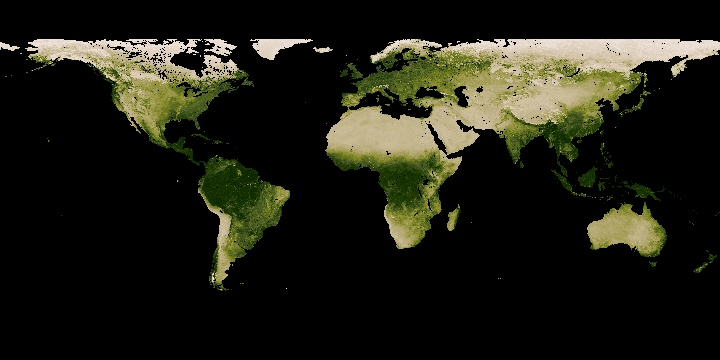
Students observe monthly images of changing vegetation patterns, looking for seasonal changes occurring throughout 2017. These data can be used by students to develop their own models of change.
List of all Biosphere Mini Lessons


Teachers, these mini lessons/student activities are perfect "warm up" tasks that can be used as a hook, bellringer, exit slip, etc.
Students review a video that models the global impact of smoke from fires, to develop an understanding of how models can be used to interpret and forecast phenomenon in the Earth System.
This mini lesson engages students with answering questions on cause and effect relationships by watching a NASA video related to changing forests in the Pacific Northwest from 1984 to 2011.
This mini lesson engages students by watching a NASA video related to plant growth activity around the world using data from the NASA/NOAA Suomi NPP satellite and answering questions on these stability and change relationships.
Observe the seasonal global images of the chlorophyll data from 2017 and put in chronological order.
Students observe seasonal images of Monthly Leaf Area, looking for any changes that are occurring throughout the year.
Students observe seasonal images of Monthly Normalized Difference Vegetation, looking for any changes in vegetation that are occurring throughout the year. They put the images in order based on what they know about seasonal changes.
This mini-lesson guides students' observations of soil moisture anomalies (how much the moisture content was above or below the norm) for the continental US in May 2018.
Students can interact with NASA data to build a custom visualizations of of local, regional, or global plant growth patterns over time. Use the Earth System Data Explorer to generate plots of satellite data as yo