
Grade Level: 6-8,
9-12
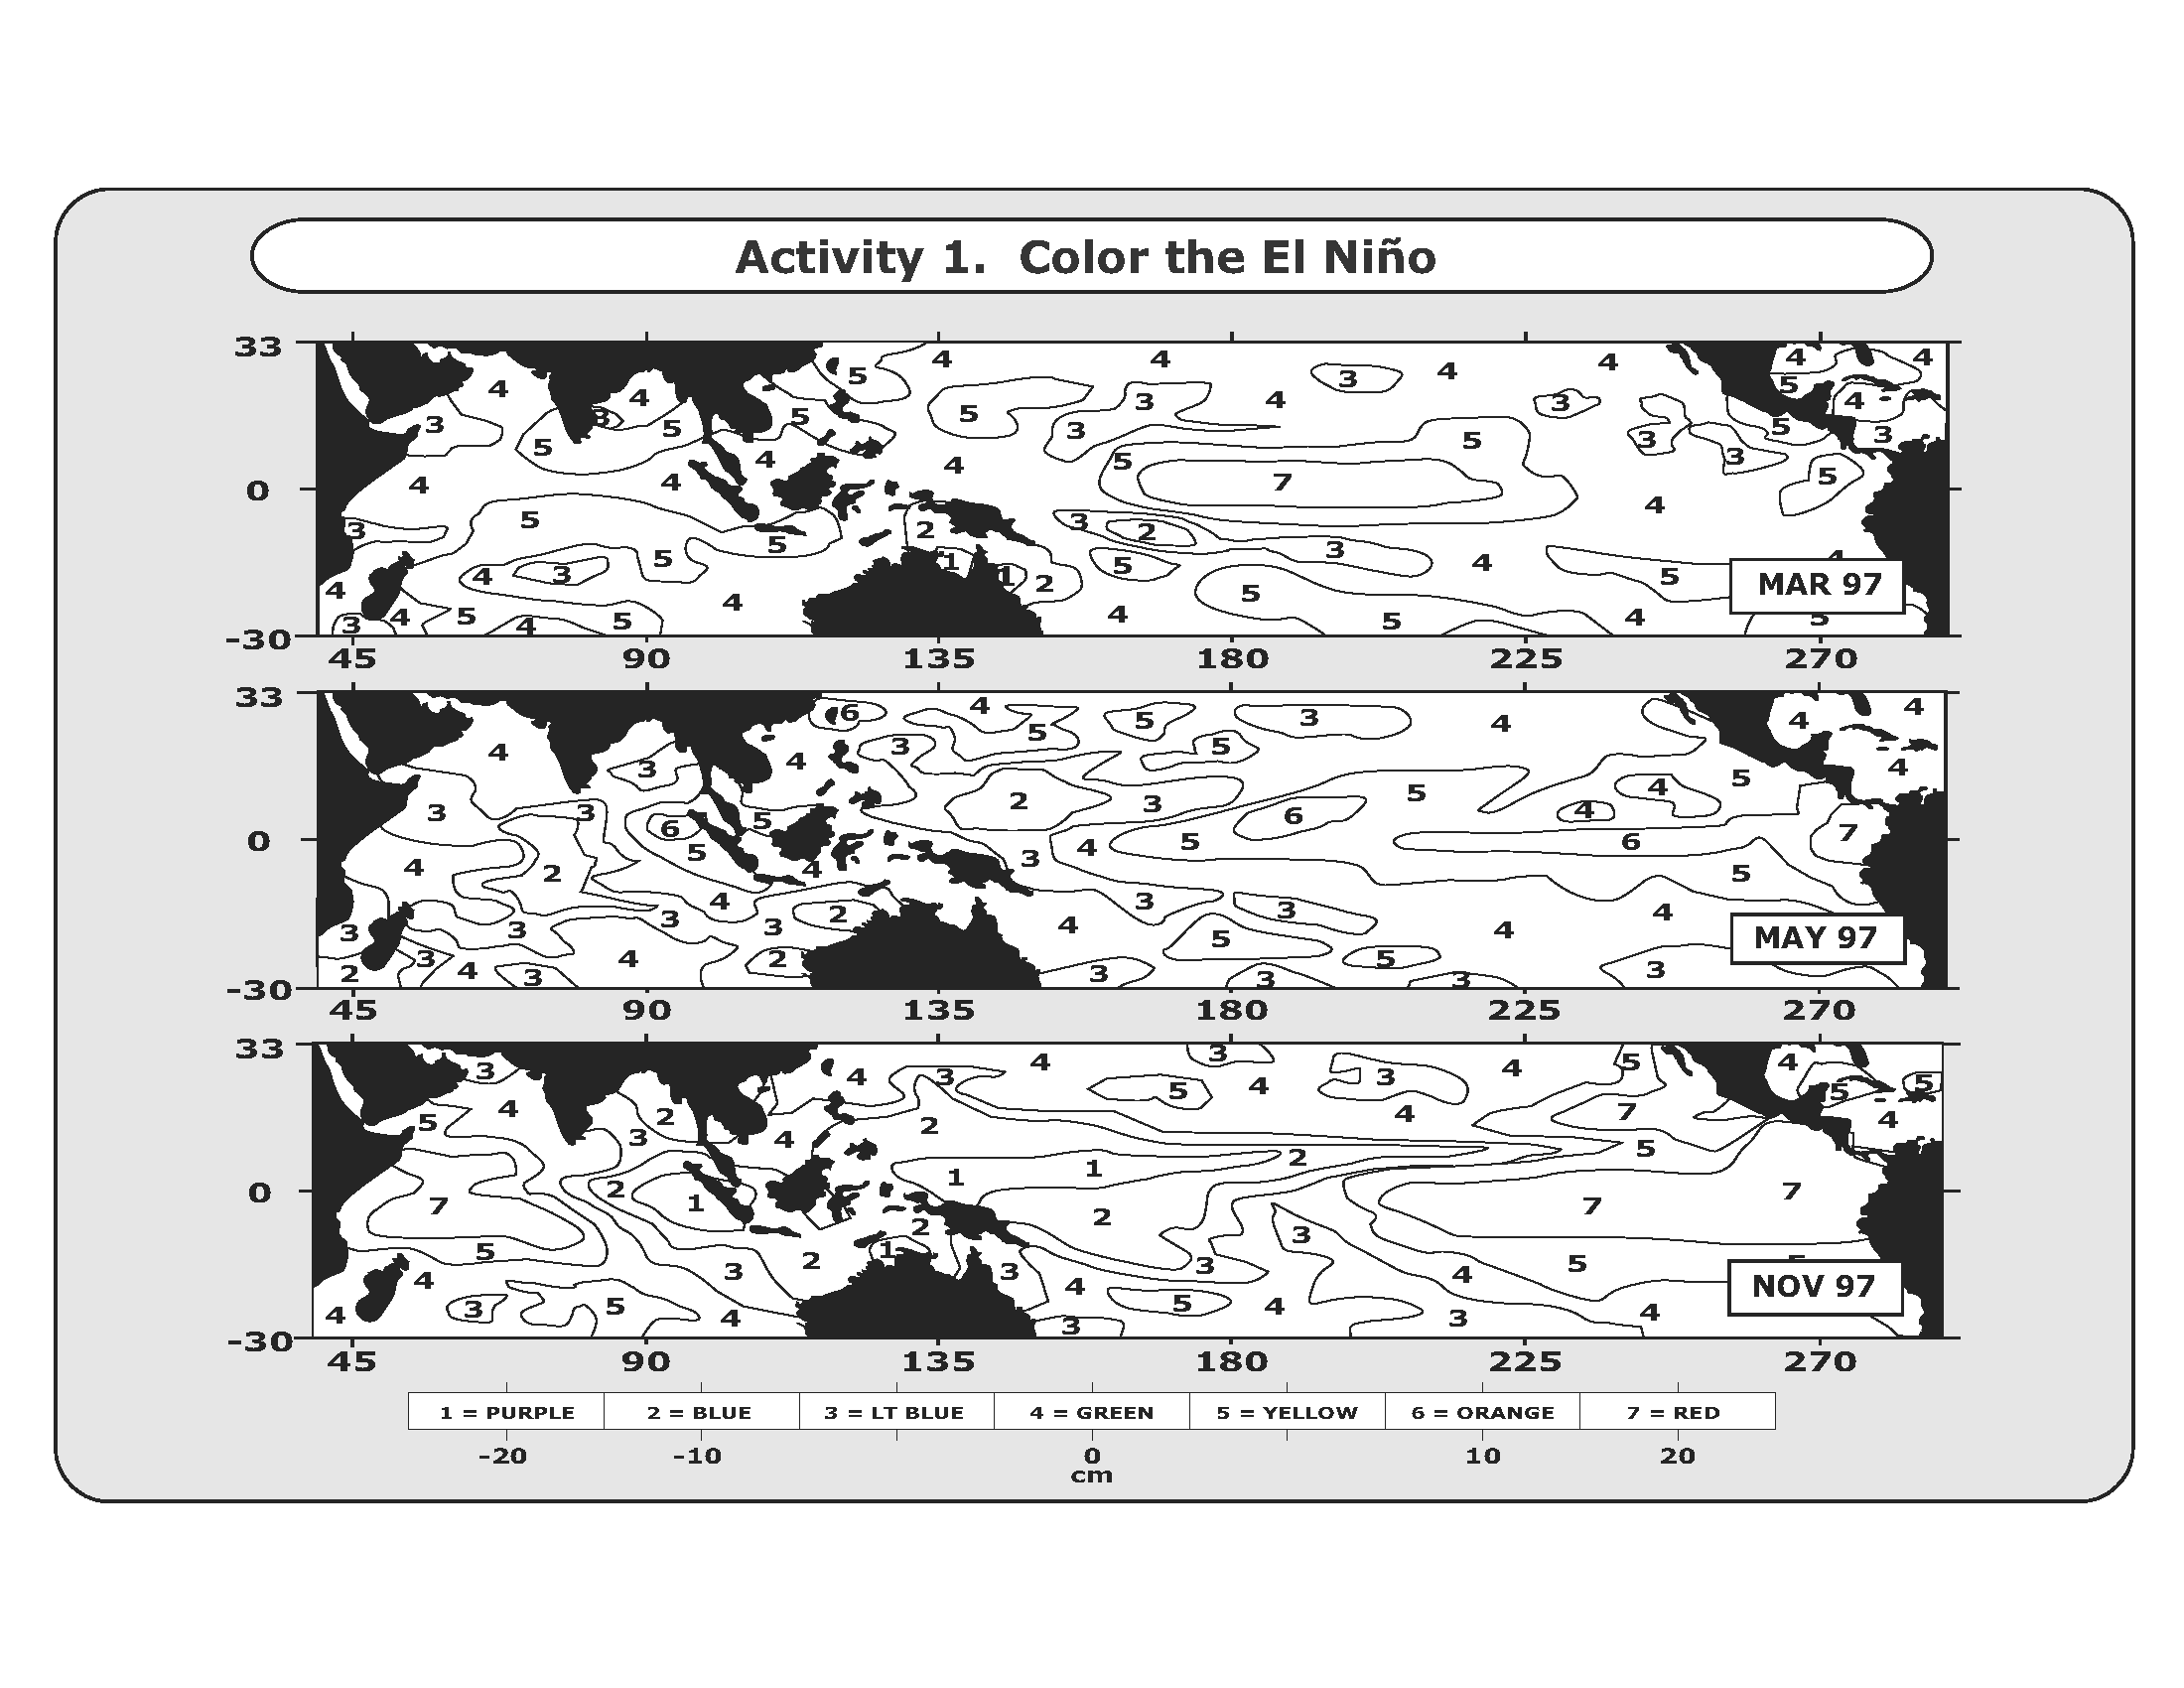
Students will use coloring sheets to create a color coded model of El Niño and analyze it. If the Data Literacy Map Cube is used with this, students will color their models first.
El Niño is a condition that sometimes occurs in the Pacific Ocean, but it is so big that it affects weather all over the world.


Students will use coloring sheets to create a color coded model of El Niño and analyze it. If the Data Literacy Map Cube is used with this, students will color their models first.

This mini lesson focuses on the 2015-2016 El Niño event and how its weather conditions triggered regional disease outbreaks throughout the world. Students will review a NASA article and watch the associated video to use as a tool to compare with maps related to 2
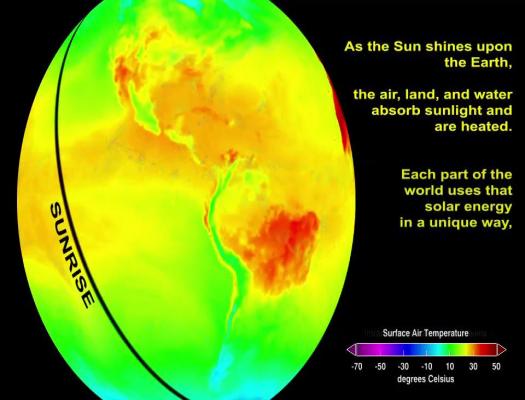
Students review a video showing how the ocean is warmed by solar energy. This is the first video of a four-part series on the water cycle, which follows the journey of water from the ocean to the atmosphere, to the land, and back again to the ocean.

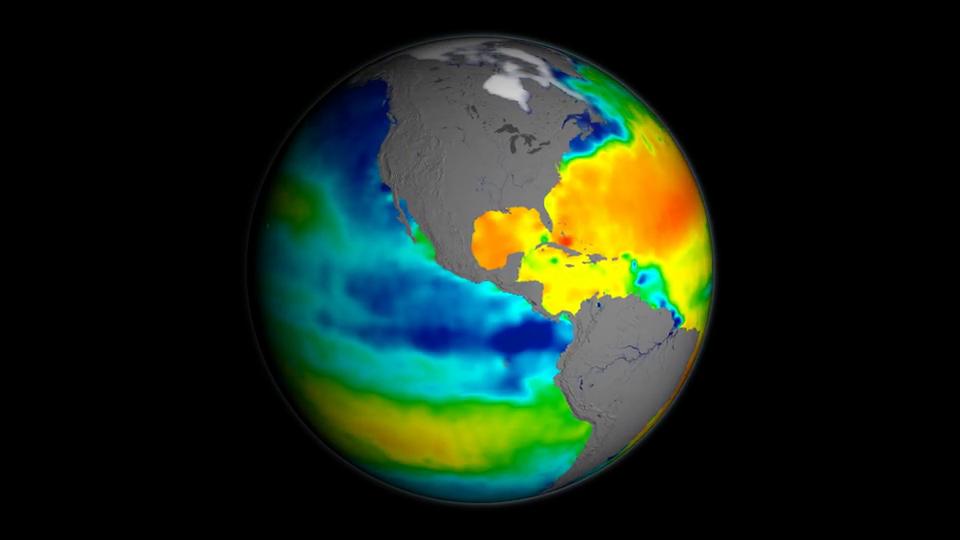
This NASA visualization shows sea surface salinity observations (September 2011-September 2014). Students review the video and answer questions.
Students will use coloring sheets to create a color coded model of El Niño and analyze it. If the Data Literacy Map Cube is used with this, students will color their models first.
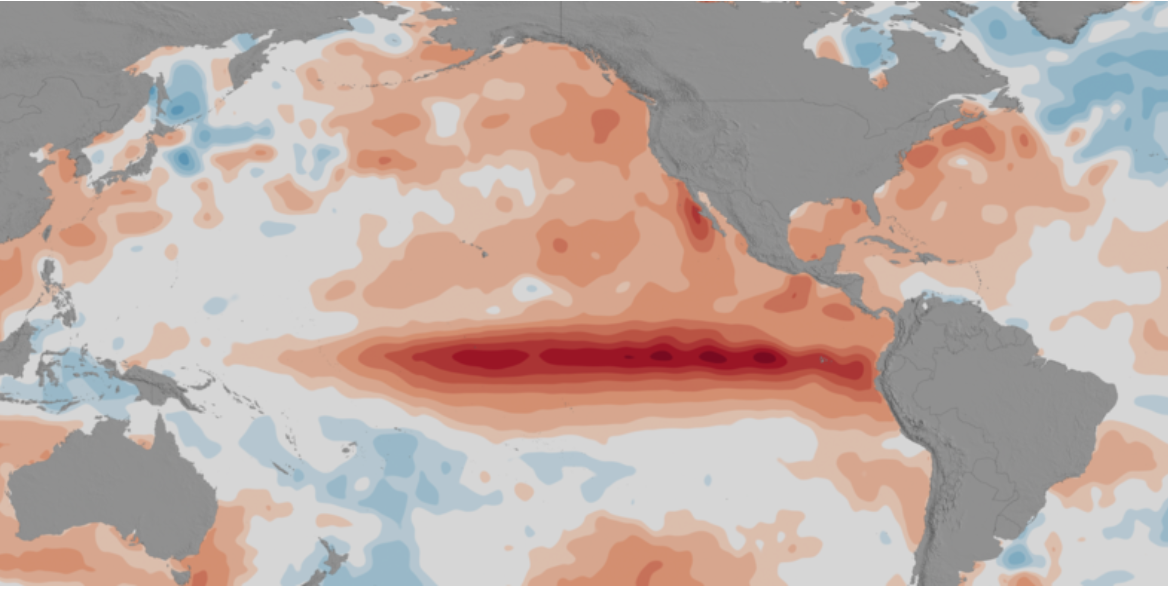
This mini lesson focuses on the 2015-2016 El Niño event and how its weather conditions triggered regional disease outbreaks throughout the world. Students will review a NASA article and watch the associated video to use as a tool to compare with maps related to 2
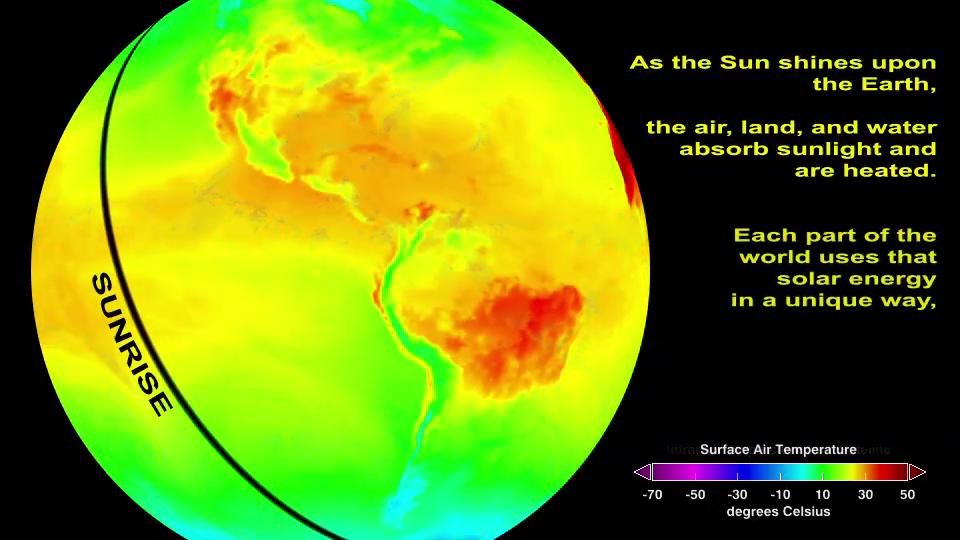
Students review a video showing how the ocean is warmed by solar energy. This is the first video of a four-part series on the water cycle, which follows the journey of water from the ocean to the atmosphere, to the land, and back again to the ocean.
This NASA visualization shows sea surface salinity observations (September 2011-September 2014). Students review the video and answer questions.