El Niño is a condition that sometimes occurs in the Pacific Ocean, but it is so big that it affects weather all over the world.
>> Read More >>
Just one moment,
loading Hydrosphere...
Featured Interactives
-
-
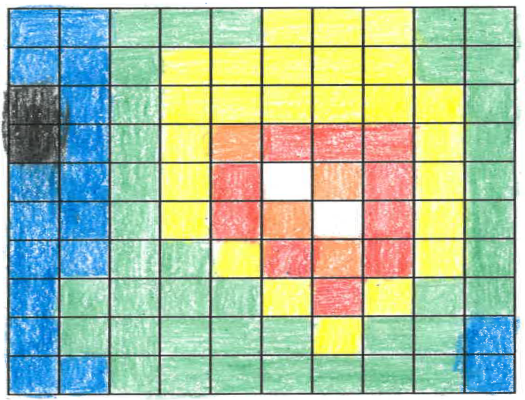
Grade Level: 6-8
Scientific data are often represented by assigning ranges of numbers to specific colors. The colors are then used to make false color images which allow us to see patterns more easily. Students will make a false-color image using a set of numbers.
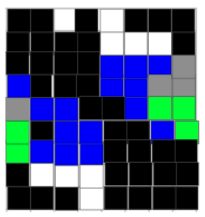
Grade Level: 9-12
Information from satellites if often used to display information about objects. This information can include how things appear, as well as their contents. Explore how pixel data sequences can be used to create an image and interpret it.
Previous
Next
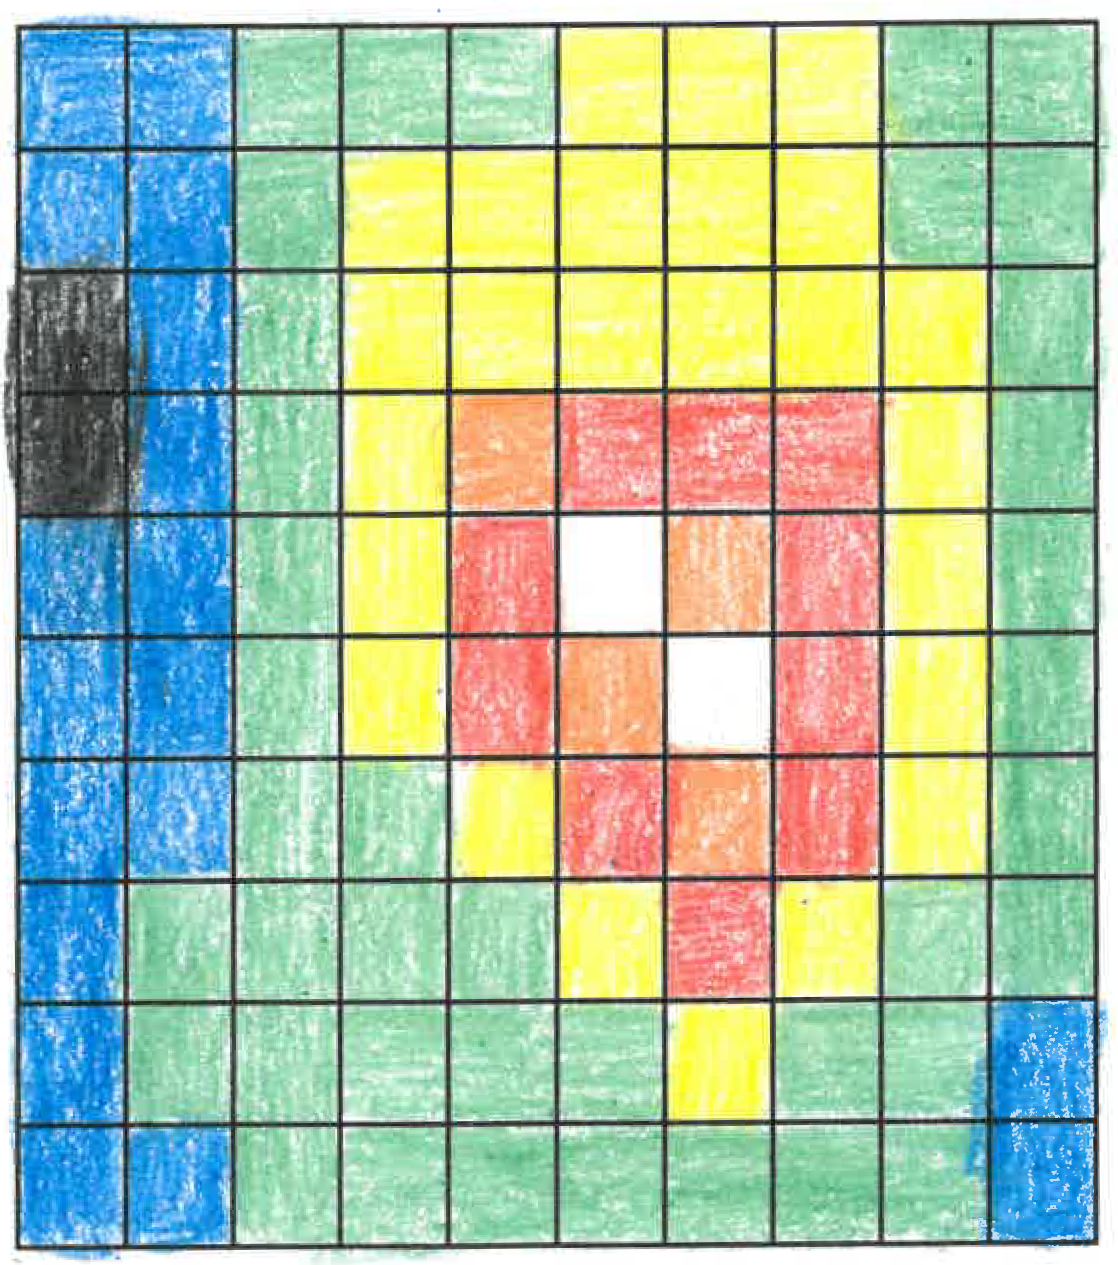
Grade Level: 6-8
Scientific data are often represented by assigning ranges of numbers to specific colors. The colors are then used to make false color images which allow us to see patterns more easily. Students will make a false-color image using a set of numbers.
Grade Level: 9-12
Information from satellites if often used to display information about objects. This information can include how things appear, as well as their contents. Explore how pixel data sequences can be used to create an image and interpret it.
El Nino Southern Oscillation landing page. Explore maps, graphs, data, and related education resources. These resources include lesson plans, mini lessons, activities, and datasets for teachers and students.