Guide to Using NASA Worldview in the Classroom
 NASA Worldview is a free online visualization tool that is a great launchpad for learners who are new (or veteran) users of satellite data. Students and teachers interact with NASA's daily, global satellite imagery of the Earth within hours of it being acquired! Complete with an interactive tour and the intuitive interface, Worldview provides supports that help students navigate the various features. Worldview pulls daily information from many different data centers around the Earth and features contemporary phenomena and how they change over time; unfortunately, students are unable to analyze data for basic exploration such as averages, data ranges, etc. Consider Earth System Data Explorer or NEO to access visualizations with built-in analysis tools.
Benefits for teachers:
- Satellite imagery helps to engage prior knowledge and connect science phenomena to everyday life
- Create “permalinks” to Worldview in your Google Classroom or other content management systems so that students do not have to learn how to use the visualization - they can access preloaded maps to begin exploring!
- Display “before” and “after” views of a specific event or phenomenon via animation
Features include:
- select a base map
- overlay layers of data
- insert markers to pinpoint a location of interest
- create videos of your maps
- compare before and after maps of events
- share and download your maps
Getting Started:
- Open NASA Worldview in your favorite browser.
- Review (or dismiss) the Worldview tour.
Creating a Video:
The timeline lets you pinpoint the date for which you want to view satellite data. There are a few different methods that you can use to navigate the timeline.
- First, click Days, Months, or Years to set the range of the timeline.
- Click and drag the slider to quickly sweep through and choose a particular date.
- Click directly on the timeline to jump to a specific date.
- Click the left or right arrows to move forward or backward day by day.
- Use the button above and below the year, month, or day to advance the date or return to a previous date.
-
If you’d like to see an animated series of maps for easy comparison, click the animation button.
a. Choose how fast the animation should run by adjusting the frames-per-seconds slider.
b. Move the white arrow on the timeline to set your start date and the blue arrow to set your end date. Then click the play button.
c. You can also easily create an animated gif by clicking the gif button.
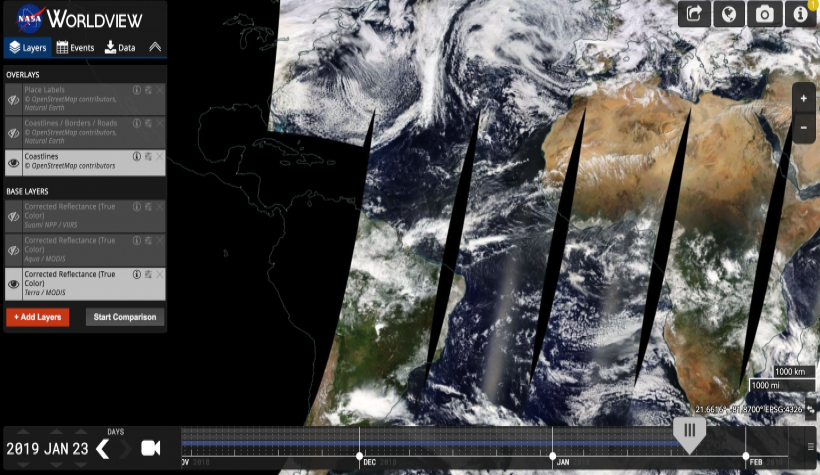
Select a Base Layer
What is a "base layer"? A base layer is often the first layer added at the start of your investigation. It is the background image of the planet that you will superimpose (add) satellite data to.
- Click
 icon to show and hide layers.
 - Click
 to remove layers.
 - Drag the base layers to reorder them.
Tip: While you can have multiple layers active, you can only see one at a time. The topmost active layer is the one that you are seeing.
Add a Layer (Overlay)
What is an "overlay"? An overlay is a partially transparent layer that sits on top of the base layer. It contains the satellite data you are interested in investigating. There are three default overlays (Place Labels, Coastlines/Borders/Roads, and Coastlines) that you can view by clicking the ![]()
- You can also choose from a selection of additional overlays by clicking +Add Layers. (Note: You can also use the search field in the Add Layers screen to find a suitable overlay.)
- When you select an overlay (ex: Aerosol Optical Depth) you’ll have the option of choosing which satellites and instruments you want to gather data from.
- Once you’ve chosen a satellite, select your overlay by clicking the orange box.
- Repeat this process to add additional overlays. If you select multiple overlays, you may need to adjust the opacity (transparency-level) of an overlay so that you can see through the information layer to the layer/s lying beneath. To do this, click
 .
. - Return to your view by closing the Add Layers screen.
Adjusting the Map
- To "pan" the map (or exploring the map at the same scale) drag it with your mouse.
- To zoom (change the scale level):
- Use the mouse wheel.
- Use the
 icons on the right.
 - To zoom to a specific location, double-click that location on the map.
- To zoom in on a box, hold down the Shift key and use the mouse to draw a box around the selection you’d like to zoom in on.
- You can also have the map automatically focus in on an event.
- Click and select the event you’d like to zoom in on.
Share and Download your Maps
- To create a permanent, shareable link to a particular view, click
 .
. - To change between Arctic, geographic, and Antarctic views, click
 .
. - To download an image of your current view, click
 .
. - To see more information on Worldview and its data sources, click
 .
. - To download NASA satellite data from a particular event, you must first have a data layer, such as Aerosol Optical Depth selected:
- Next, click
 .
. - Select the data product you would like to download by clicking one of the radio buttons.
- To select data for a particular point, click
 .
. - Finally, click
 .
.
Credit: NASA EOSDIS & NASA HEALTH AND AIR QUALITY APPLIED SCIENCES TEAM
Disciplinary Core Ideas:
Crosscutting Concepts:
- Patterns
- Cause and Effect
- Scale, Proportion, and Quantity
- Systems and System Models
- Stability and Change


