Grade Level: 3-5,
6-8,
9-12
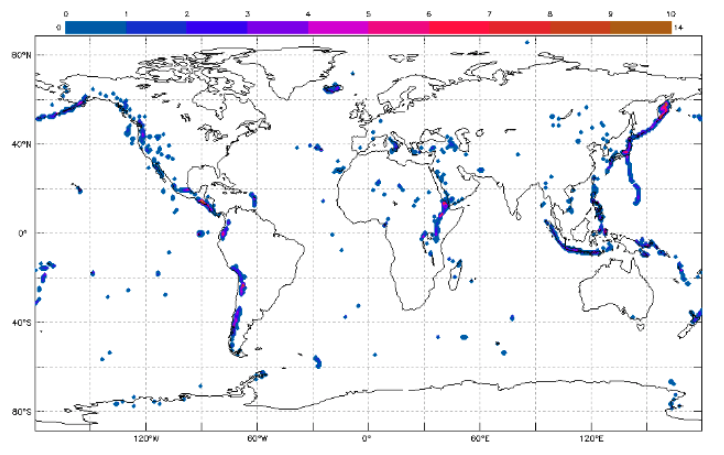
Teachers, are you looking for resources to help you engage students in data analysis related to Volcanic Eruptions? Check out this image.

Select a Sphere:





Teachers, are you looking for resources to help you engage students in data analysis related to Volcanic Eruptions? Check out this image.
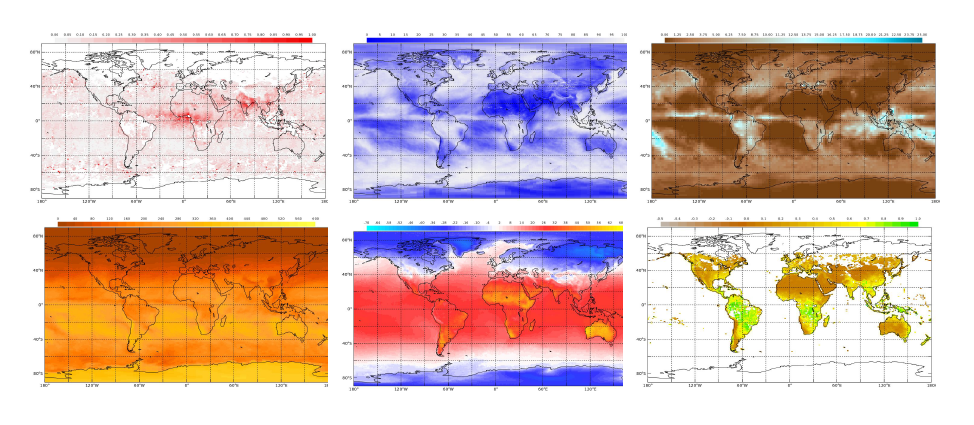
The Earth System Satellite Images help students observe and analyze global Earth and environmental data, understand the relationship among different environmental variables, and explore how the data change seasonally and over longer timescales.
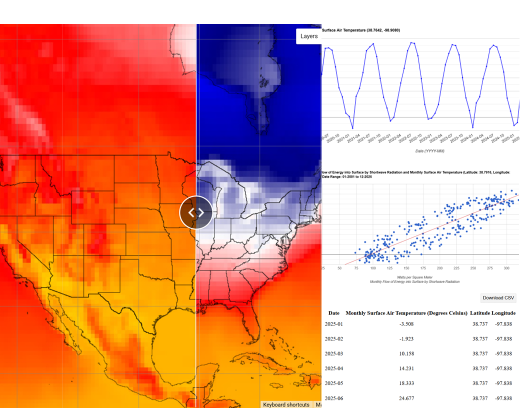
Do you need tools to help using the Earth System Data Explorer? MND offers several ways to learn more about how to use this data visualization tool.

The My NASA Data visualization tool, Earth System Data Explorer (ESDE), helps learners visualize complex Earth System data sets over space and time.
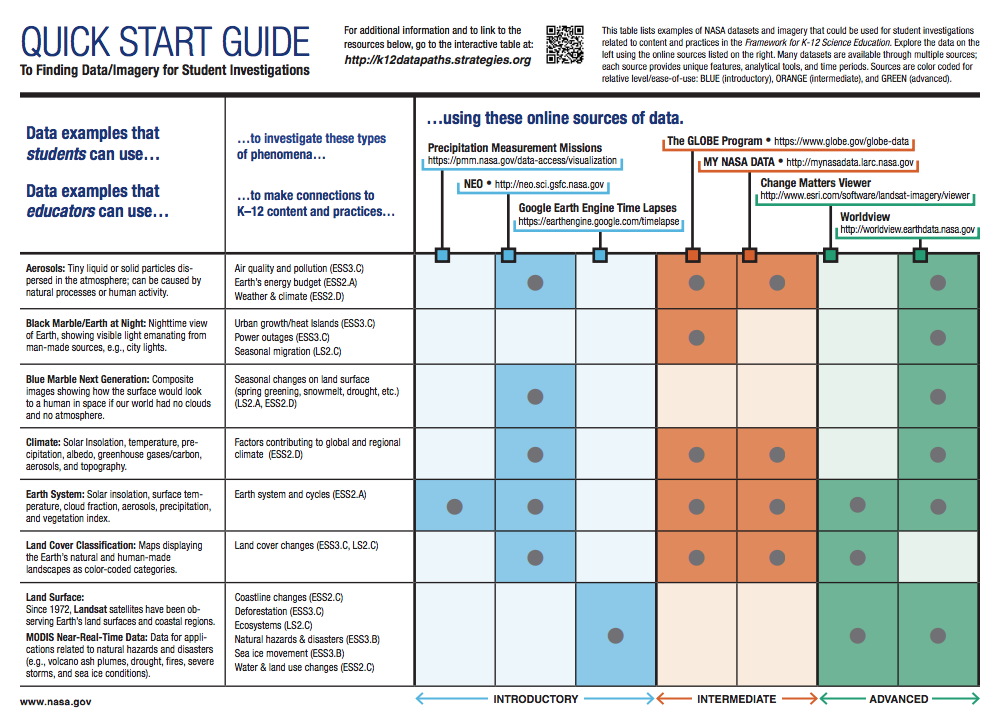
The Quick Start Guide lists examples of NASA datasets and imagery that could be used for student investigations related to content and practices in the Framework for K-12 Science Education.
This tutorial explains how to download data from the My NASA Data Earth System Data Explorer and import it into Google Sheets.
Do you need instructions for how to use data from the Earth System Data Explorer in Microsoft Excel? Visit this link to access a step-by-step guide.
NASA visualizers take data – numbers, codes – and turn them into animations people can see and quickly understand.

Explore a variety of NASA resources.
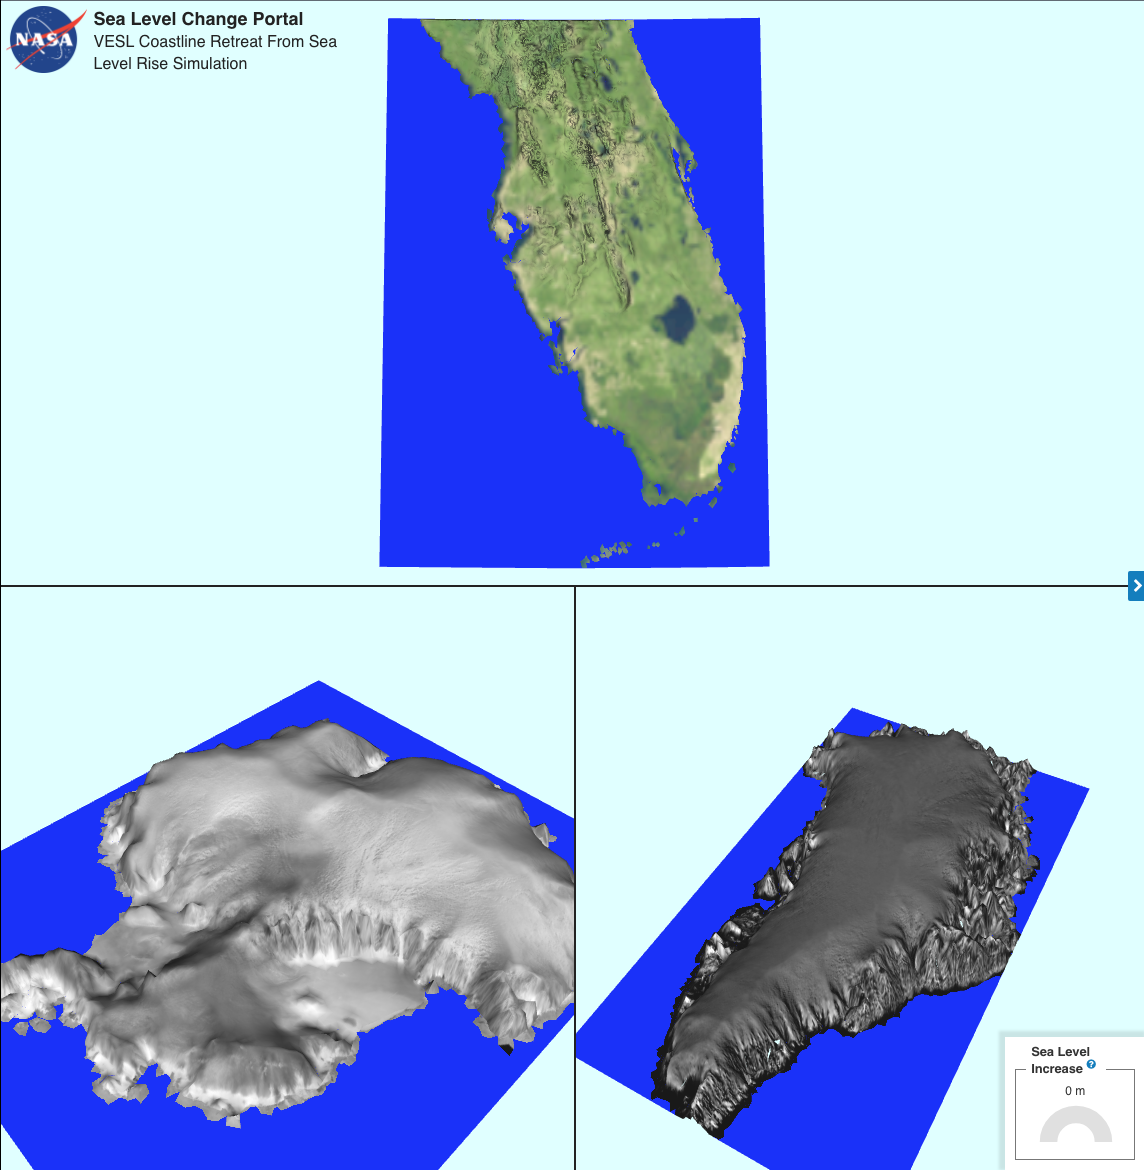
Check out this interactive data visualization and simulation tool. It explores the impact of collapsing polar ice sheets (Greenland and Antarctica) and their impact on global mean sea level rise, along with shrinkage in the livable area around the world.
These data resources are designed to help teachers integrate authentic NASA data into their lessons to support problem-based learning (PBL) and other data-rich lessons. These education tools are useful to address data literacy in the Earth Science classroom.




