Grade Level: 3-5,
6-8,
9-12
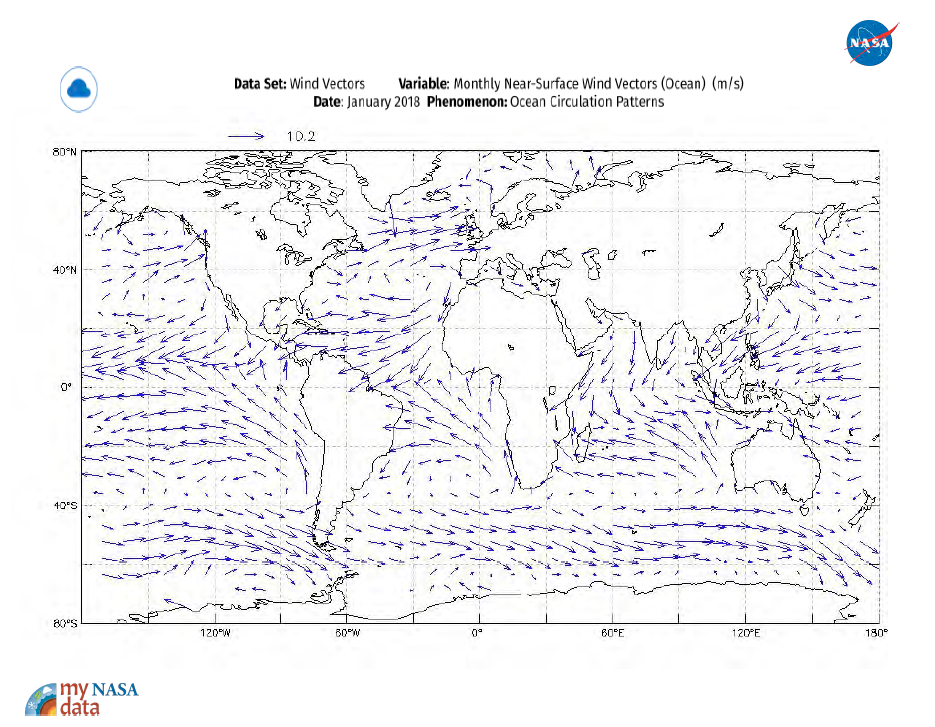
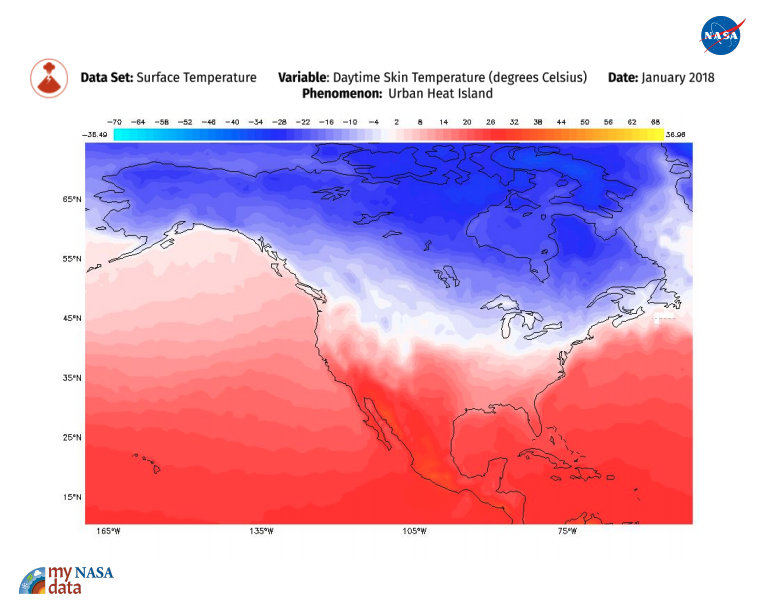
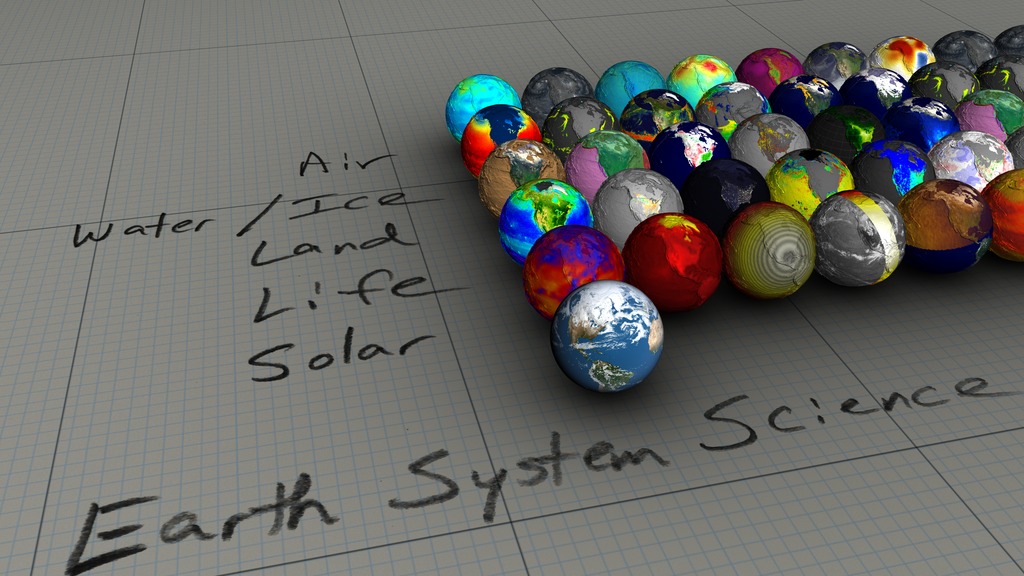
The Earth System Satellite Images help students observe and analyze global Earth and environmental data, understand the relationship among different environmental variables, and explore how the data change seasonally and over longer timescales.