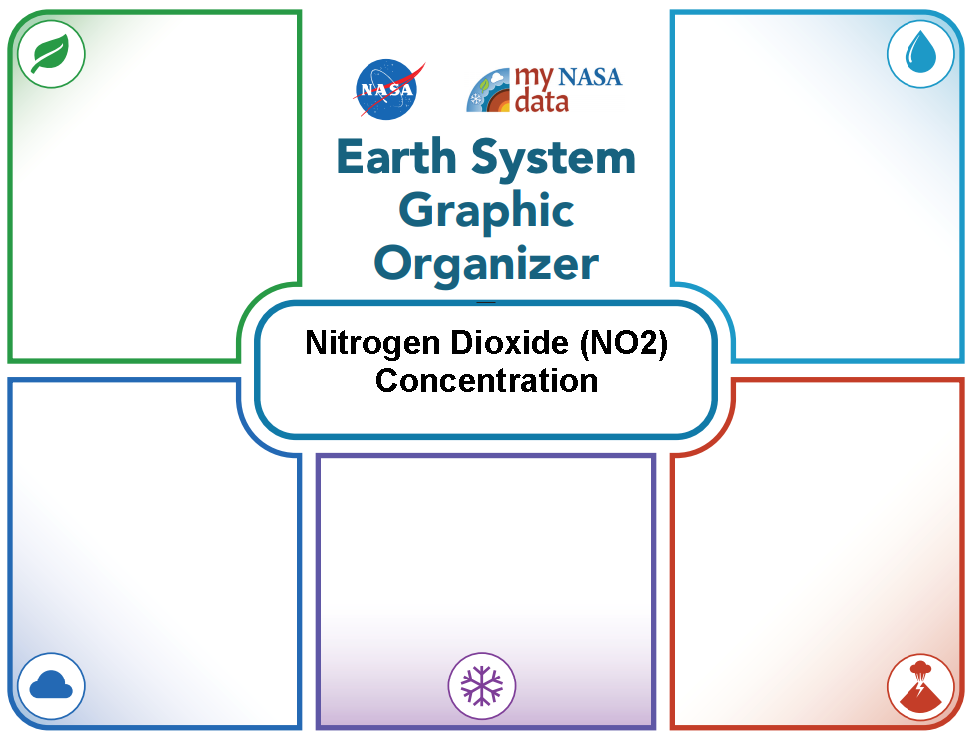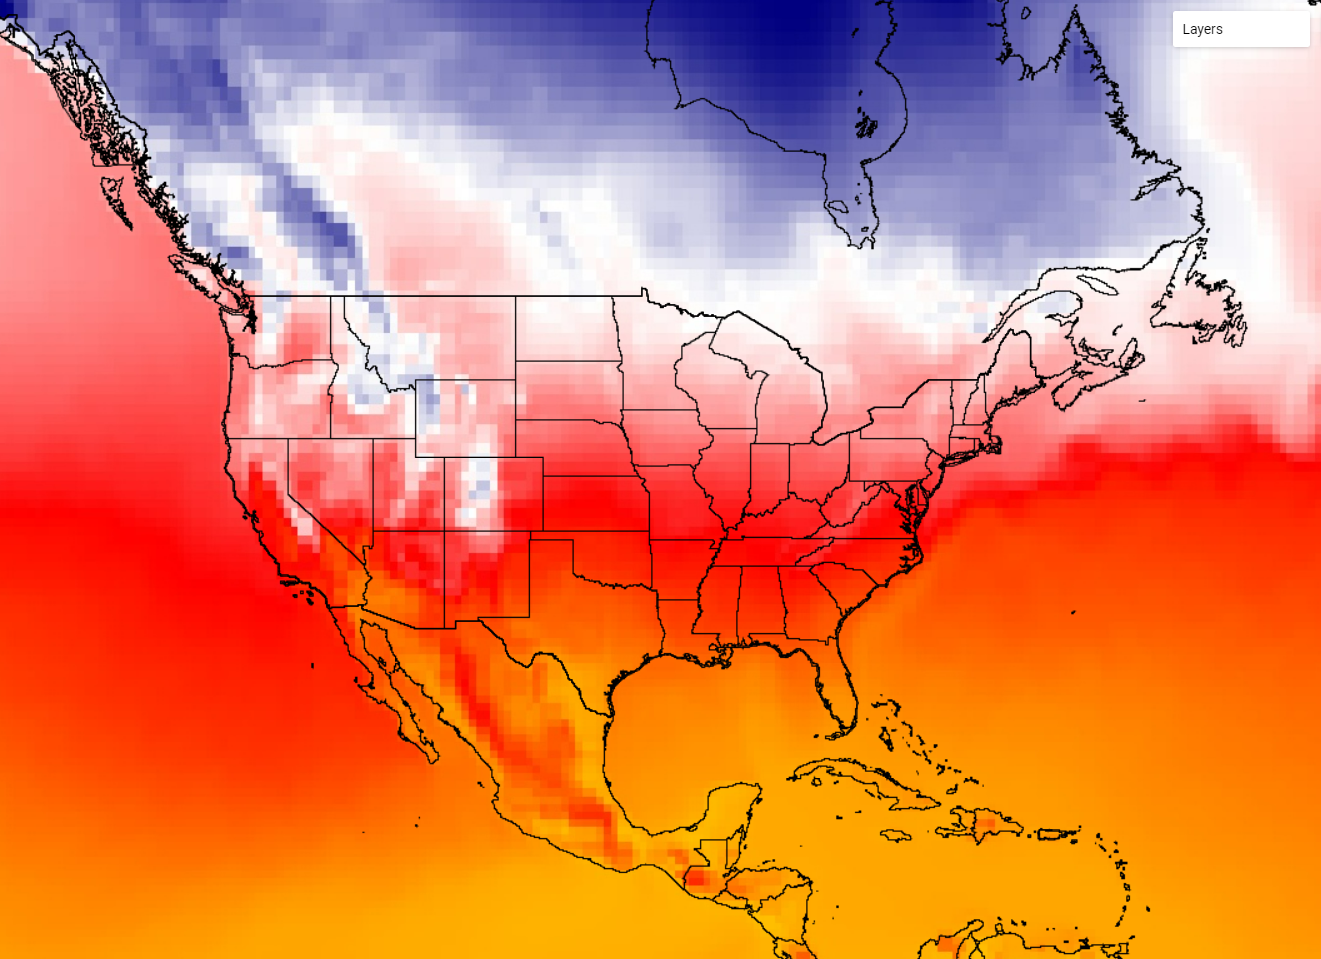




The Earth System Satellite Images, along with the Data Literacy Cubes, help the learner determine relationships among variables.
List of all Earth as a System Data Resources
The Earth System Satellite, help the learner visualize how different Earth system variables change over time. In this lesson, students will graph six points for a location over one year.
Students will explore the relationship between Nitrogen Dioxide and Precipitation in Earth's atmosphere. They will explore the data provided, make a claim, and complete a slide guided by a rubric.
The Earth System Satellite Images, along with the Data Literacy Cubes, helps the learner identify patterns in a specific image.
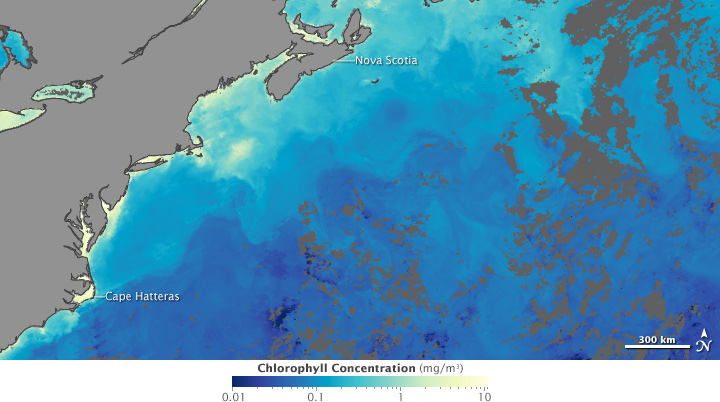
Students analyze and compare satellite data of Ocean Chlorophyll Concentrations with Sea Surface Temperatures, beginning with the North Atlantic region, while answering questions about the global patterns of these phenomenon.
Download NASA satellite data to create a custom climograph for a specific location.