Grade Level: 3-5,
6-8,
9-12
My NASA Data has recently released several new resources, StoryMaps, for use in educational settings.
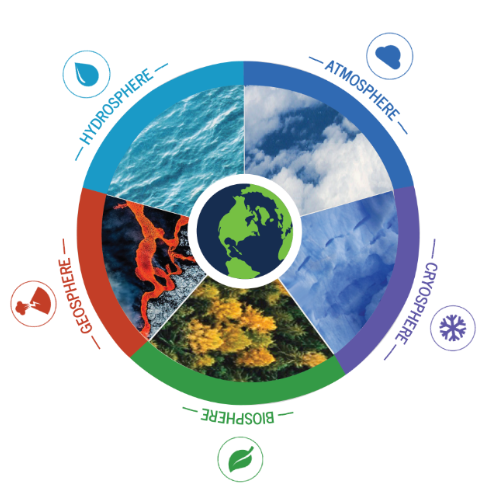
Select a Sphere:


My NASA Data has recently released several new resources, StoryMaps, for use in educational settings.

This video provides tips for teachers on helping students make sense of data to help them understand and work with data.

This video is a resource that can be used alongside any activity that involves creating and developing questions. While the video focuses on questions about trees, the basic principles are necessary for asking scientific questions.
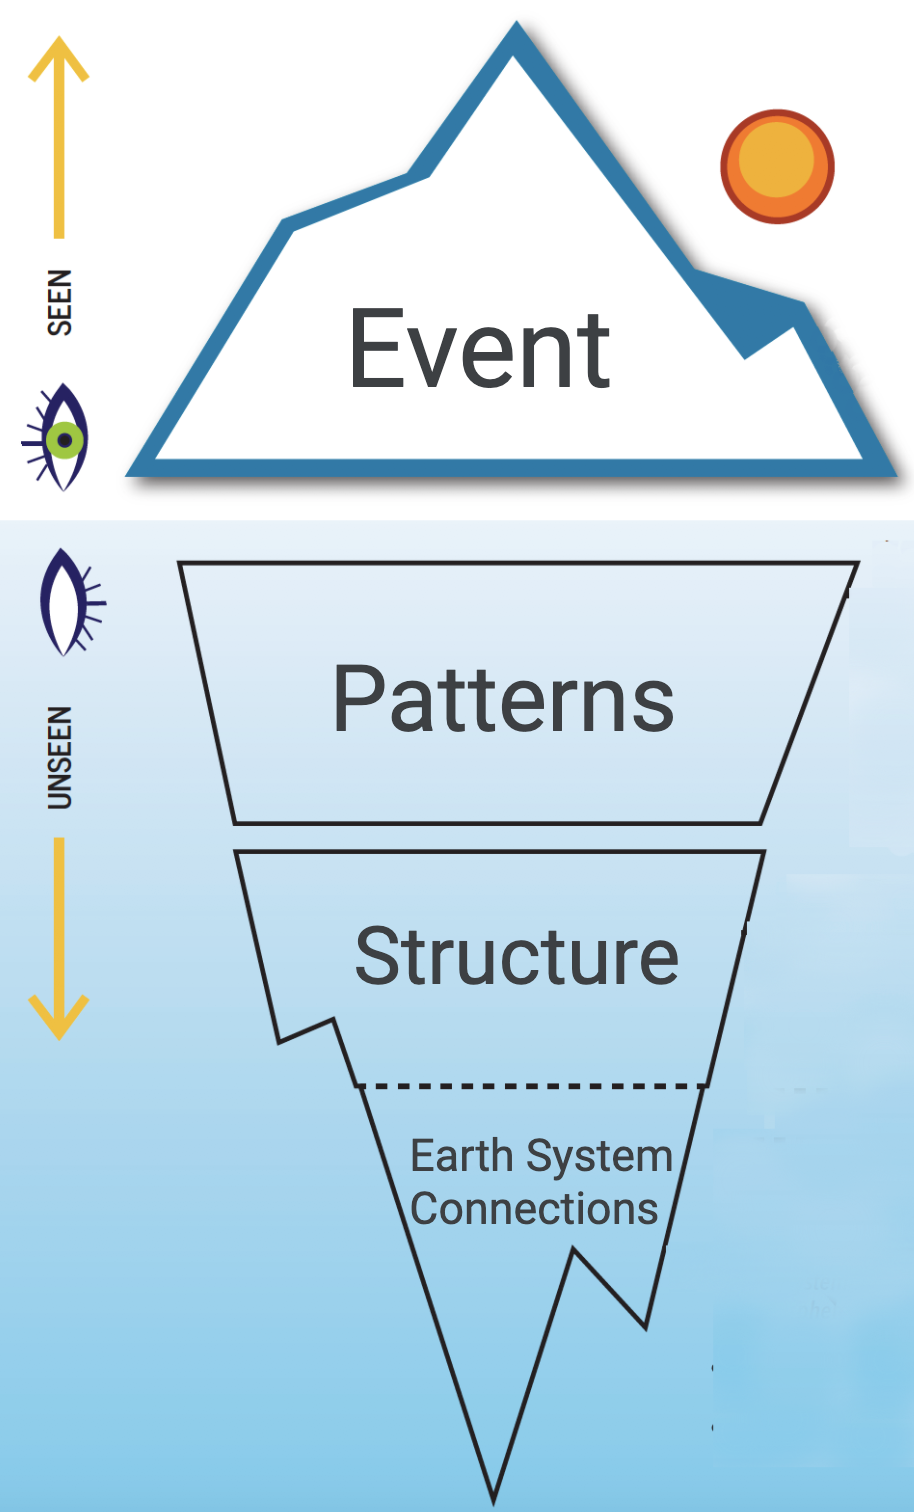
In Earth System Science, underling factors affecting observable phenomena can be difficult to identify and describe. The Iceberg Diagram diagram uses the metaphor of an iceberg to demonstrate the idea of visible vs hidden as it relates to Earth science phenomena.
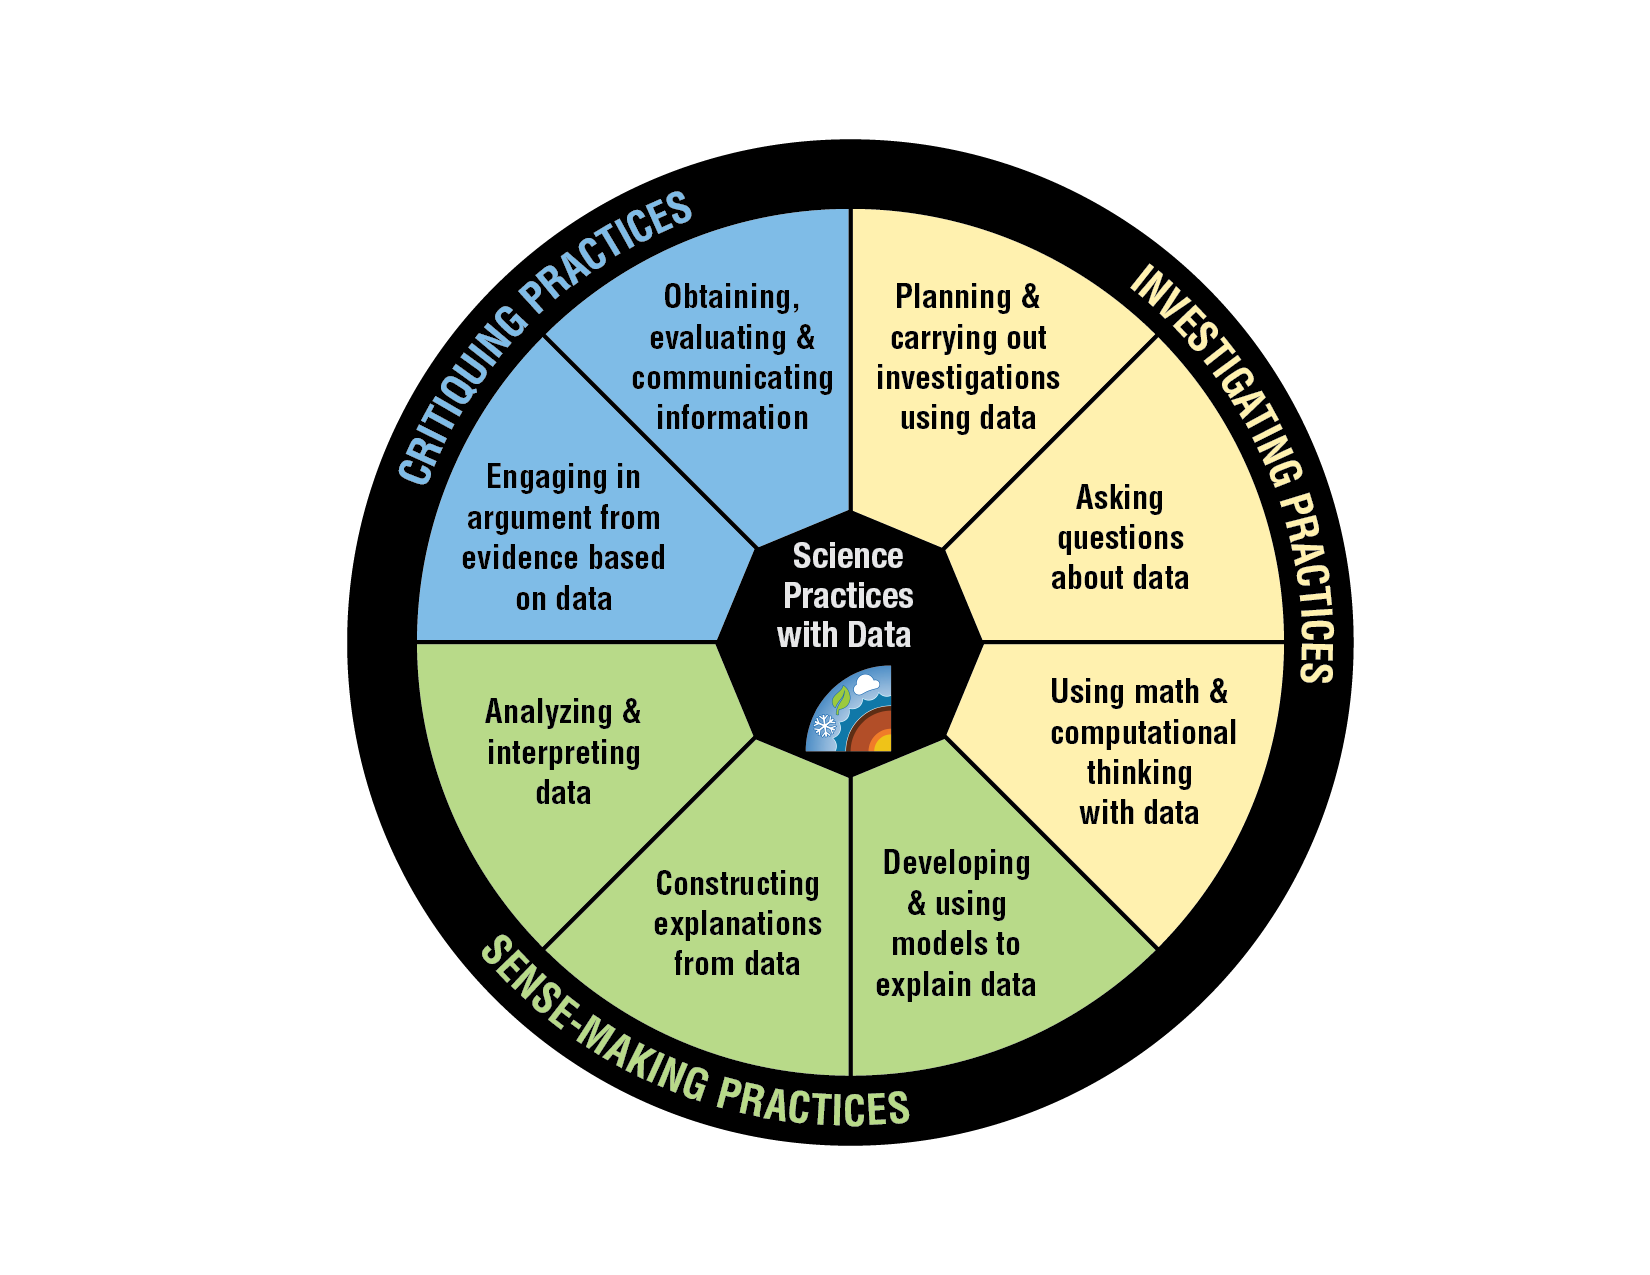
Are you searching for resources to use with your students related to Science and Engineering Practices? Review these graphics that will help to hone students' attention to the specific practices in science and how they relate to investigating, sense-making, and critiquing of data.

The My NASA Data visualization tool, Earth System Data Explorer (ESDE), helps learners visualize complex Earth System data sets over space and time.

The Earth System Satellite Images, help the learner visualize how different Earth system variables change over time, establish cause and effect relationships for a specific variable, identify patterns, and determine relationships among variables over one year.
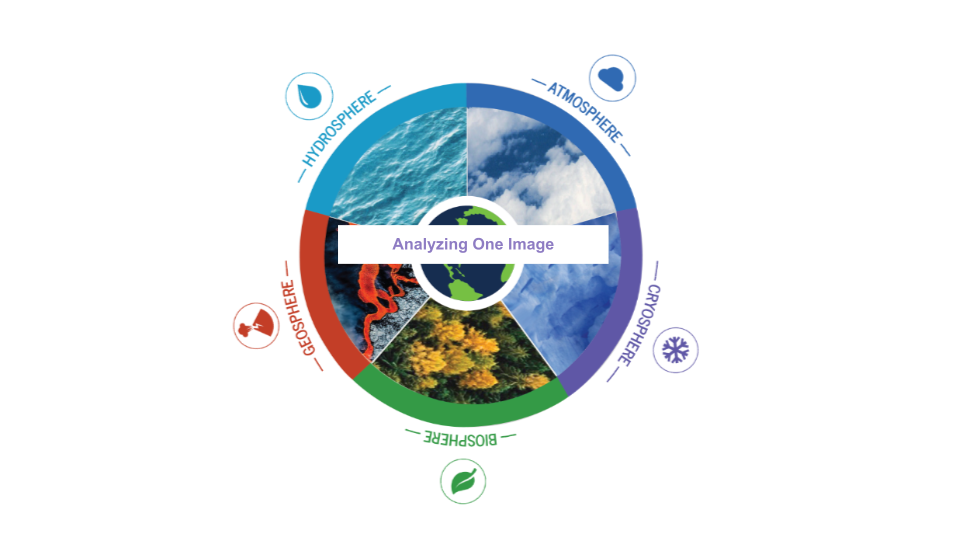
The Earth System Satellite Images, along with the Data Literacy Cubes, helps the learner identify patterns in a specific image.
The Earth System Satellite Images, along with the Data Literacy Cubes, help the learner visualize how different Earth system variables change over time, establish cause and effect relationships, identify patterns, and determine relationships among variables.

The Earth System Satellite Images, along with the Data Literacy Cubes, help the learner visualize how different Earth system variables change over time, identify patterns, and determine relationships among two variables in three months.
These data resources are designed to help teachers integrate authentic NASA data into their lessons to support problem-based learning (PBL) and other data-rich lessons. These education tools are useful to address data literacy in the Earth Science classroom.


