

Grade Level: 6-8,
9-12
In this mini-lesson, students analyze soil moisture quantities associated with Hurricane Harvey around Houston, Texas on August 25, 2017.
Soil moisture is the water that is held in the spaces between soil particles, generally in the upper 10 cm of soil. Although soil moisture is just a fraction of the total water mass in the water cycle, this small amount of water plays a critical role in evaporation and plant transpiration processes in the Hydrosphere, Biosphere, and Geosphere. It is a key variable in controlling the transfer of water and heat energy between these systems.

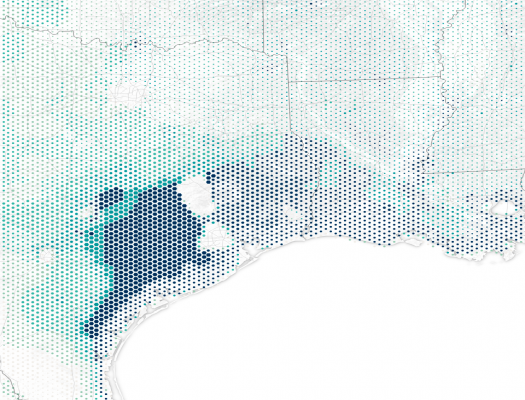

In this mini-lesson, students analyze soil moisture quantities associated with Hurricane Harvey around Houston, Texas on August 25, 2017.
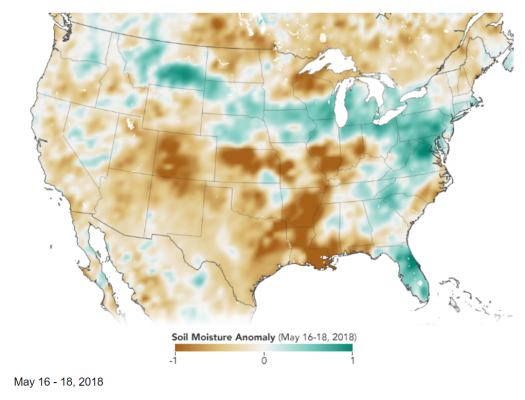
This mini-lesson guides students' observations of soil moisture anomalies (how much the moisture content was above or below the norm) for the continental US in May 2018.
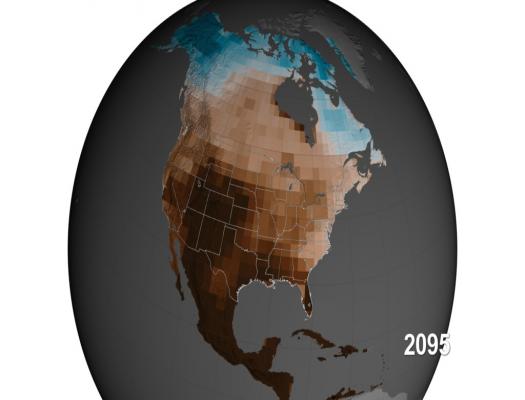
Students watch a visualization video and answer questions on the potential of increasing megadroughts in the southwest and central United States from 1950-2095 using models created by soil moisture data.

Students analyze two North Pole orthographic data visualizations produced from soil moisture data.