Mini Lesson/Activity
Soil Moisture Analysis
Overview
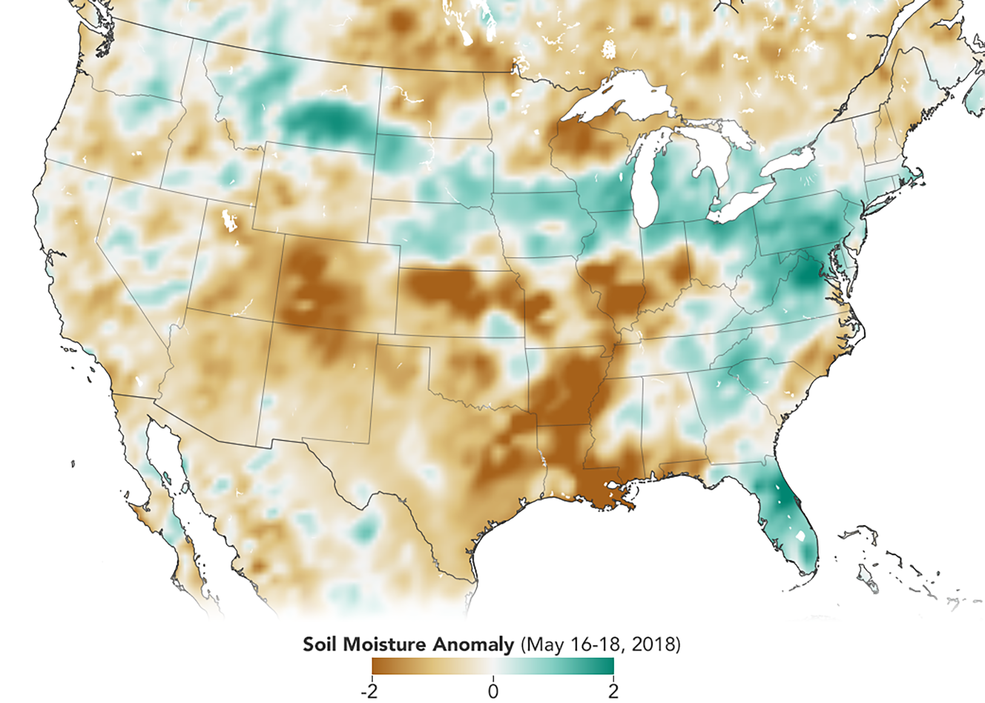
This mini-lesson guides students' observations of soil moisture anomalies (how much the moisture content was above or below the norm) for the continental US in May 2018.
Student Directions

Credit: NASA Earth Observatory
NASA Earth Observatory image by Joshua Stevens, using soil moisture data courtesy of Nazmus Sazib/NASA GSFC and the SMAP Science Team.
https://mynasadata.larc.nasa.gov/sites/default/files/inline-images/conus_smp_2018138_1041.png
In 2015, the Soil Moisture Active Passive mission (SMAP) launched. It was the first NASA satellite dedicated to measuring the water content of soils. The map above shows soil moisture anomalies. That is how much the moisture content was above or below the average. the map shows the United States in mid-May 2018. The satellite measures soil moisture in the top 5 centimeters of the ground.
Changes in soil moisture can affect crops. This is important for communities around the world.
Observe the map above and complete the tasks. Check with your instructor on how to submit your answers.
Steps
- Observe the Soil Moisture Anomaly map above, and complete the tasks. Check with your instructor on how to submit your answers.
- I see...
- Spend five minutes coming up with as many things you observe on this map.
- Start each item with, "I see..." Some general questions are:
- What is represented within this map?
- What is the range of the data?
- Where are the extreme values located?
- I think...
- Next, list as many thoughts as possible on what this map makes you think.
- Start each item with, "I think..."
- I wonder...
- The last step is to think of questions about this map.
- Create at least five statements that begin with, “I wonder…”
Teacher Note
Teachers, these mini lessons/student activities are perfect "warm up" tasks that can be used as a hook, bell ringer, exit slip, etc. They take less than a class period to complete. Learn more on the "My NASA Data What are Mini Lessons?" page.
Teachers who are interested in receiving the answer key, please complete the Teacher Key Request and Verification Form. We verify that requestors are teachers prior to sending access to the answer keys as we’ve had many students try to pass as teachers to gain access.
Disciplinary Core Ideas:
- ESS2A: Earth Materials and Systems
- ESS2C: The Role of Water in Earth’s Surface Processes
Crosscutting Concepts:
- Patterns
Science and Engineering Practices:
- Analyzing and Interpreting Data


