Lesson Plans
Behavior Over Time: Analyzing Seasonal Soil and Air Properties
Overview
Students review Earth System phenomena that are affected by soil moisture. They analyze and evaluate maps of seasonal global surface air temperature and soil moisture data from NASA satellites. Building from their observations, students will select a location in the US to extract scientific data and then create Behavior Over Time graphs for each variable and communicate their findings.
Materials Required
Per Student:
- Connection Circle
- Graph paper
- Colored Pencils (two different colors per student)
Per Group
- Group 1:
- Student Maps of Soil Moisture
- Group 2:
- Student Maps of Surface Air Temperature
Procedure
Part 1: Engaging Prior Knowledge of Common Phenomena Related to Soil Moisture
-
To engage prior knowledge, have students work in small groups to quickly describe phenomena related to soil moisture found on the Student Thinking Slips. Distribute a Student Thinking Slip to each student group. Student groups describe the phenomenon using the questions below and report out:
- Describe this phenomenon.
- What causes it? What sphere(s) does it relate to or are affected by it?
- How does it trigger changes throughout other parts of the Earth System?
-
Draw a Connection Circle on the Board, and give out a copy to each student (or have students copy Connection Circle). Instruct students to write on the connection lines why there is a connection. As students are reporting out, students should draw connecting lines to the different phenomena provided. Model this with the students.
-
Now show the SMAP Mission Video to the students. Have them write in additional information provided in the video on the Connection Circle.
Part 2: Exploring Soil Moisture & Surface Air Properties
-
Ask students to describe soil moisture and how it is related to each of the phenomena.
-
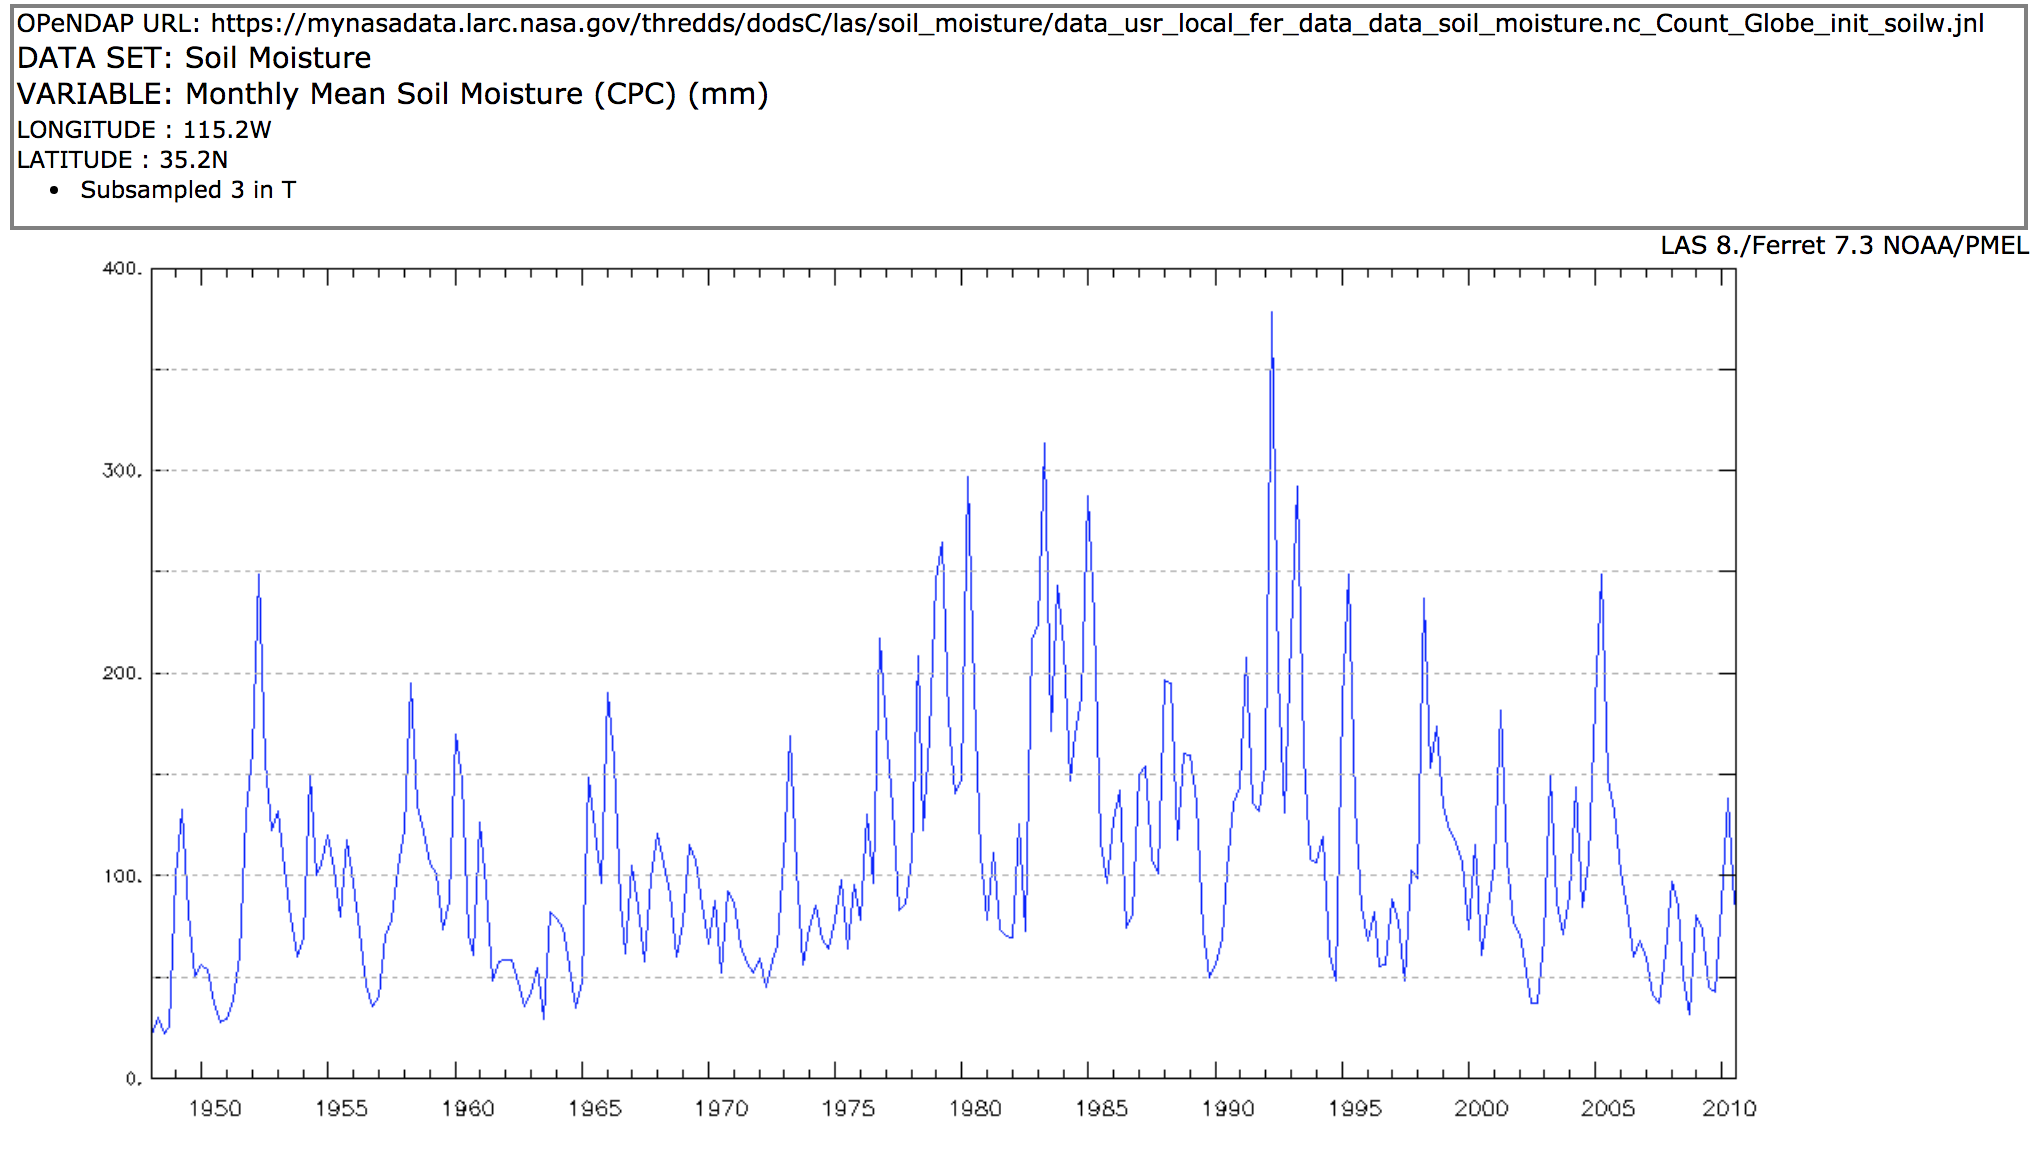
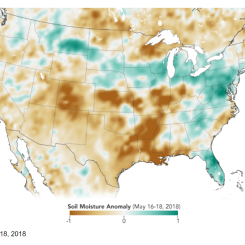
Next, students observe data visualizations of SMAP data to create BOT Graphs onto two sheets of graph paper using the mapped science data for the following variables:
- Soil Moisture - Explain that this particular dataset of soil moisture describes the monthly amount of moisture in the soil. It is the volume of water found 0-10 cm below the soil surface. Note: soil moisture may also be recorded in other depths of the soil.
- Surface Air Temperature - Explain that this quantity describes the monthly average temperature of air close to the surface. This temperature is typically measure at 2 meters above the surface. The surface air temperature is different than the skin temperature, which is the temperature of the topmost layer of the land, ocean, or ice surface. During the daytime, especially over some types of land surfaces exposed to direct sun, the surface air temperature is less than the skin temperature.
-
Distribute the Student Data Sheet and review the sheet with the students.
-
Identify on the map/s the approximate location where the school is located. You will use this location as a model. Instruct students to develop a claim for #1 and describe predictions for each season in the two variables. Then distribute the mapped images, as well as two colored pencils to graph the data (e.g., Soil Moisture in green, Surface Air Temperature in yellow).
-
Walk through the following key points of the images with the students:
-
Four images represent four different months throughout 2017 of each dataset:
- Monthly Surface Air Temperature (Degrees C)
- Monthly Mean Soil Moisture (millimeters)
- Instruct students to develop a claim for #1 as a class for their location and describe predictions for each season in the two variables. Then distribute the mapped images, as well as two colored pencils to graph the data (e.g., Soil Moisture in green, Surface Air Temperature in yellow).
- Using one of the maps as a model, identify the data values for the variable at the school's location. Note that students will observe the map’s legend and the color shades as indicators for the scientific value.
- Direct students to observe the color legend and its values. What could the false colors represent? units of measurement?
- Prepare a sample graph with students using the observed data.
- Review the range of values from each of the graphs. Tell students that they should note the full range throughout the entire year and will use these max and min values to create the values on the Y Axes.
- Time will be on the X Axes.
- Students work in groups to graph their values on their graph paper.
-
-
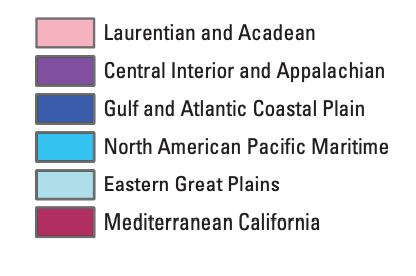
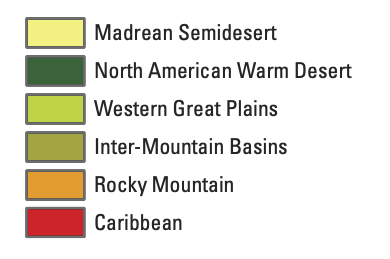
Now, break students into groups and assign a location within specific biogeographic areas to focus on, depending upon curriculum needs. Consider locations that are known to have frequent drought, landslides, forest fires, flooding, vector-borne disease, or areas that are known for crop productivity. Recommended areas may include locations within the following: Caribbean, Mediterranean California, Central Interior and Appalachian, Western Great Plains.
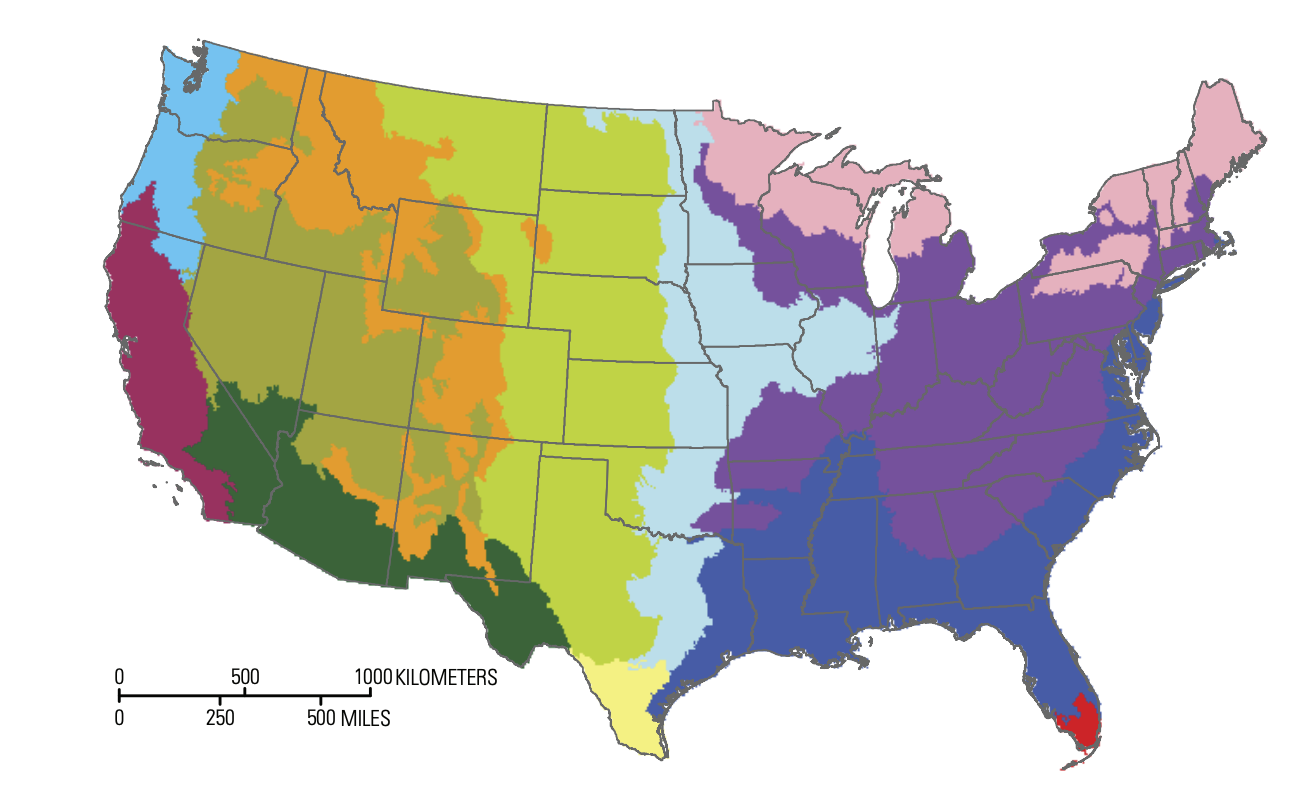
Credit: USGS
Tell students that they will create a graph of the data for each of the datasets for the approximate location on the map. Tip: Students to create graphs using the following key - soil Moisture in green, surface air temperature in yellow. Note: Students should plot data on the graph using two different colored pencils for the two different datasets. Allow time for students to graph their data.
- Students identify their group's assigned locations on the maps provided and begin preparing their graphs by creating a title (e.g., Graph 1., 2017 Monthly Mean Soil Moisture (millimeters); Graph 2., Seasonal Air Surface Temperature ℃)
- Next, students should document their observations in the data table in the B. Section: Observed Evidence for each season.
- Students work in groups to graph their values.
Part 3: Interpreting the Data
-
Students should revisit their claim and predictions as compared to their evidence. They describe any ideas that the evidence has sparked and any scientific principles that affect their findings.
-
What is the relationship of these variables? NOTE: The relationship between soil moisture temperature is complex. The basic relationship is that surface temperature is higher when soil moisture is lower, but this relationship is affected by other factors (latitude, soil type, vegetation type, land use (irrigation), etc.).
-
Next, prompt students to identify times when these variables have the largest range in values, smallest range.
-
How do these data values support (or not) the the idea that a given location is susceptible to drought, landslides, forest fires, flooding, vector-borne disease, or areas that are known for crop productivity?
-
Have student groups report their findings and share with the class.
Disciplinary Core Ideas:
- ESS2A: Earth Materials and Systems
- ESS3A: Natural Resources
Crosscutting Concepts:
- Cause and Effect
- Systems and System Models
- Stability and Change
Science and Engineering Practices:
- Developing and Using Models
- Constructing Explanations and Designing Solutions
- Use evidence to create an explanation.
- Observe the seasonal changes of surface temperature and soil moisture from across the United States during 2017.
- Analyze temperature and moisture values and infer relationships between these variables.
- Create Behavior Over Time graphs of two datasets.
- How does increasing atmospheric temperatures affect the Geosphere?
- How does water connect the soil, the Atmosphere, and the Biosphere?
- What role does the Sun’s energy play in the hydrologic cycle? What evidence do you have?
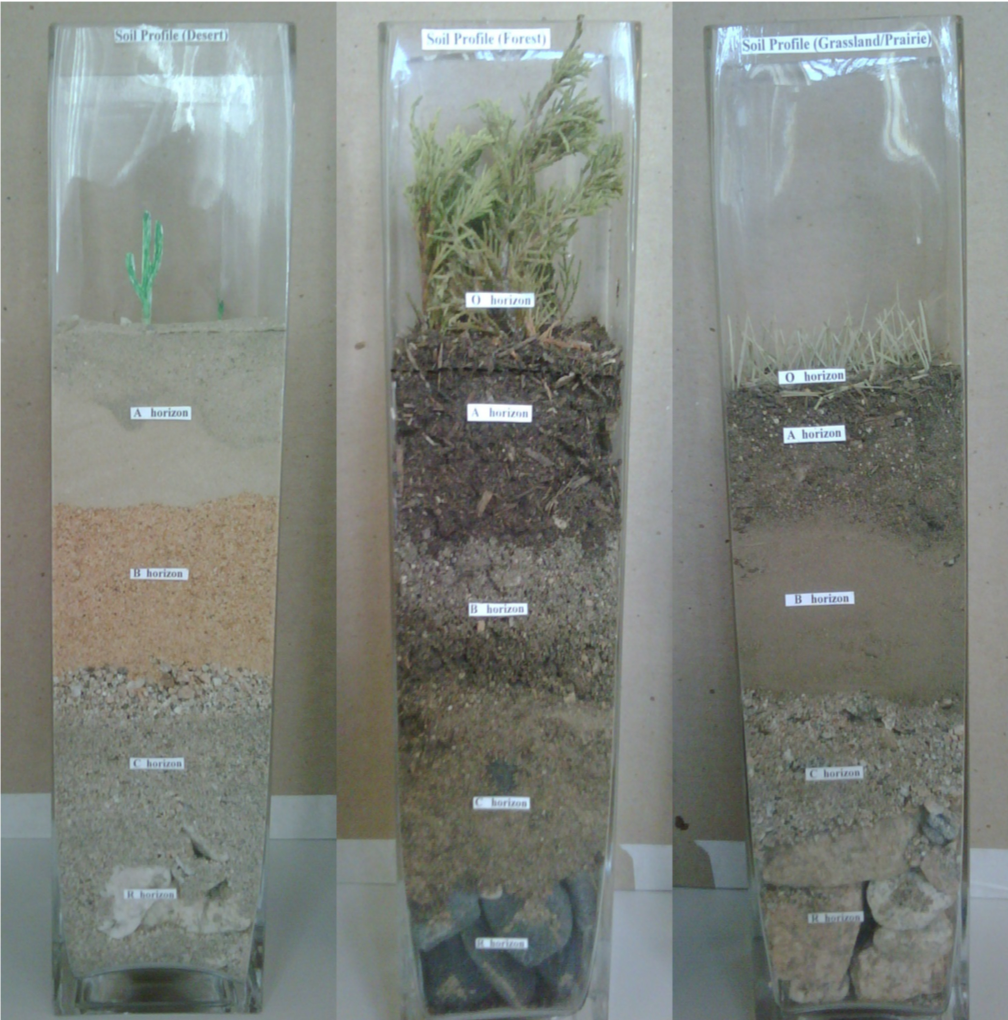
Understanding Soil Moisture
When exploring soil moisture, it is important to note that as compared to the amount of water stored elsewhere on the planet, the amount in the soil is minuscule. But that small volume has great significance around the world. Soil moisture controls how much precipitation is soaked into the ground and how much turns into runoff. Average layer soil moisture is the depth-averaged amount of water present in a specific soil layer beneath the surface.
Soil moisture is measured at different depths based on instruments and models. The U.S Drought Monitor reports soil moisture in the top 10 cm; where as the NASA SMAP mission measures it in the top 5 cm. Soil moisture can also be reported down to one meter or 100 cm. This is derived from various models; it is called the root zone. These numbers are shown in the Student Handouts.
Soil moisture content is frequently reported in units of kg/m², which is the amount of water in the layer per square meter of soil. Soil moisture is also reported in millimeters, which is the depth of water if you collected all of the water in the soil layer and put it into a container the same size as the soil layer.
NASA actively monitors soil moisture and these measurements have practical applications that range from food availability to flood safety and weather forecasting. Water, energy and carbon exchanges between the land and the air are linked together through soil moisture. Detailed monitoring of soil moisture provides a view of how our whole Earth system works. The health of Earth’s biosphere is dependent on the flow and storage of water, energy, and carbon. Our global climate and its future changes are dependent on how these major Earth cycles link and vary together. Global change is the major environmental challenge of our century, and its impacts can cause major shifts in how our societies will function in the future.
Through soil moisture data collection, NASA sensors provide critical information for drought early warning. In fact, a deficit in the amount of moisture in the soil defines agricultural drought. The measurements from Soil Moisture Active Passive mission, SMAP, are tools for mitigating drought in the future. Researchers forecast a threefold increase in drought frequency in many regions of the world by the end of the 21st Century. History shows that a sustained drought can result in crop failure, deaths of livestock, and ultimately deaths of people. There is an economic impact as well. It is estimated that the 2012 drought in the Midwest led to harvest failures costing an estimated $30 billion.
Soil monitoring is a critical factor for evaluating healthy plant growth and will help improve crop yield forecasts and irrigation planning around the world. By indirectly monitoring global food production, NASA will improve targeting of humanitarian food assistance. Studies estimate that climate change will increase the number of undernourished people worldwide in 2080 by 5-26%.
Having a better understanding of soil moisture will also improve our ability to predict and warn residents about an impending flood by assessing how wet the soil is before a rainstorm. Floods are the #1 natural disaster in the United States and they account for 40% of all natural disasters worldwide. Flooding is the leading cause of weather-related deaths in the United States. Flash flood guidance is updated at least every 24 hours based on surface soil moisture. Losses due to floods here average billions of dollars per year.
The amount of water available to evaporate from the land surfaces can be used by meteorologists to improve their forecasts of local and regional weather over spans of days to weeks. Forecasting the weather requires continuously observing the state of the atmosphere and including the level of moisture of the soil and water sources on the ground. Nearly 90% of the emergencies declared by the Federal Emergency Management Agency and approximately 70% of air traffic delays are caused by weather, at a cost of many billions of dollars per year.
Modified from NASA SMAP.
Connection to the following Earth System phenomena:
- Drought Extent - Decreased soil moisture creates drier soils and often produces less runoff over longer periods of time.
- Landslide Risks - Landslides are natural disasters that cause enormous loss of physical property and human lives. They are becoming more prevalent in mountainous regions of many countries. Soil moisture, along with groundwater, are key variables in triggering slope failure causing landslides.
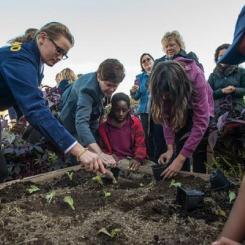
- Crop Productivity: Soil moisture plays a critical role in farming as it relates to plant growth and agricultural productivity, especially during conditions of water shortage and drought. Knowing moisture content in the soil is important before, during, and after the growing season.
- Forest Fire Risks - Soil moisture, along with temperature, relative humidity,
- wind speed, and vegetation (fuel density) are key factors contributing to fire frequency. Scientists recently modeled and calculated that dry areas are generally at higher risks for more frequent and larger fires over time. They also report that grasslands that have high moisture content in the spring result in more flammable environments during the summer.
- Flooding Potential - Seasonal cycles of soil moisture content and snowfall/snowmelt increase flooding potential along streams, rivers, and urban and coastal flooding.
- Vector-borne Diseases: Vector-borne diseases, caused by pathogens and parasites, are transmitted through living organism carriers known as vectors. Mosquitoes, the most common disease vectors, transmit illnesses such as Zika, West Nile, chikungunya, malaria, dengue, and yellow fever, which affect millions of people across the world and kill more than one million people each year. Soil moisture is a condition that influences breeding habitats of mosquitoes.
Behavior Over Time (BOT) Graphs:
Scientists in the 21st Century are forced to consider complex or “wicked” problems through interdisciplinary lenses and often utilize processes called Systems Thinking to level up their ability to understand the underpinnings of complex systems, such as climate change, water and food shortage, mass migration, etc. An important skill for systems thinkers is the process of documenting and evaluating Behavior Over Time (BOT). BOT graphs are not new to science teachers as graphing is often seen as the first step to better understanding complex systems. BOT graphs are line graphs that include time (x-axis) and one or more variables (y-axis). Processing the data in the BOT and then communicating findings is a critical part of the BOT process. Students are encouraged to move beyond graphing variable/s where they begin to explain system’s behavior over time.
Connection Circles:
Connection Circles are useful for developing students’ systems thinking abilities. These circles provide a graphic organizer for students to analyze parts of a system and how those parts affect one another. Write the parts of a system that change over time around edges of the circle. Draw lines from one part to the other to show that they are related to one another and cause/effect relationships. For more information on how to use Connection Circles, check out this video.
- Locating geographical locations using latitude and longitude and a world map
- Graphing
- Reading map legend
-
The majority of secondary students struggle with the idea that water vapor in air can come from water in plants and in the soil.
Credit: AAAS Science Links
National Geography Standards:
- How to use maps and other geographic representations, tools, and technologies to acquire, process, and report information from a spatial perspective.
- The physical processes that shape the patterns of Earth's surface.
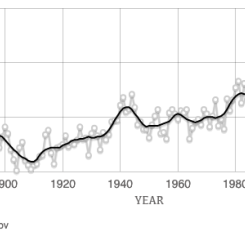
Scientists worldwide warn of increasing temperatures in the future. There is a relationship between soil moisture and surface air temperature and this plays an important role in climate change that involves not only weather and climate but also the entire Earth System. NASA scientists strive to better understand how water availability changes around the globe, as well as better predict floods and drought in weather models. As Earth's temperature rises, our soils dry out and affect crop production, drought extent, and forest fire to name a few. NASA also researches additional phenomena connected to soil moisture properties including landslide risks and vector-borne diseases (i.e., include but are not limited to cholera, malaria, dengue fever, Zika, schistosomiasis, and West Nile fever).
- Geoscientists - Research physical properties of the earth, such as rocks, soils, and other materials.
- Soil and Plant Scientists - Explore the breeding, production, and management of crops, trees, and plants.
- Conservation Scientists - Research, manage and protect natural resources like soil, forests, and water.
- Atmospheric and Space Scientists - Investigate weather and climate-related phenomena to prepare weather reports and forecasts for the public
- Earth Drillers, Except Oil and Gas - Explore minerals and soil properties through a variety of drilling and testing measures.
- Agricultural Engineers - Solve problems that are related to the way farms work.
- Computer and Information Scientists - Conduct research in the field of computer and information science
- Remote Sensing Scientists and Technologists - Research a variety of topics using techniques that allow the study of an object or phenomena without making contact directly with the object such as analyzing geological and geographical data. They typically work with aerial or satellite pictures.
- Standalone Lesson (no technology required)
Complementary Lesson Plans


Grade Band
- 6-8
- 9-12
Time
- 50 minutes
Visualization Tool
NGSS Three Dimensional Learning
- See drop-down menu at the bottom of the page