Lesson Plans
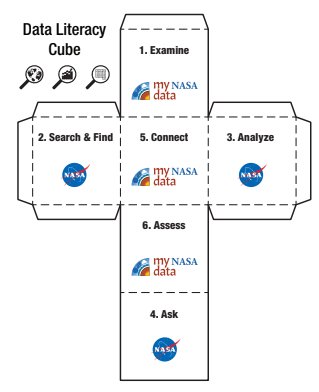
Data Literacy Cube: Graph Data using Soil Moisture Data
Overview
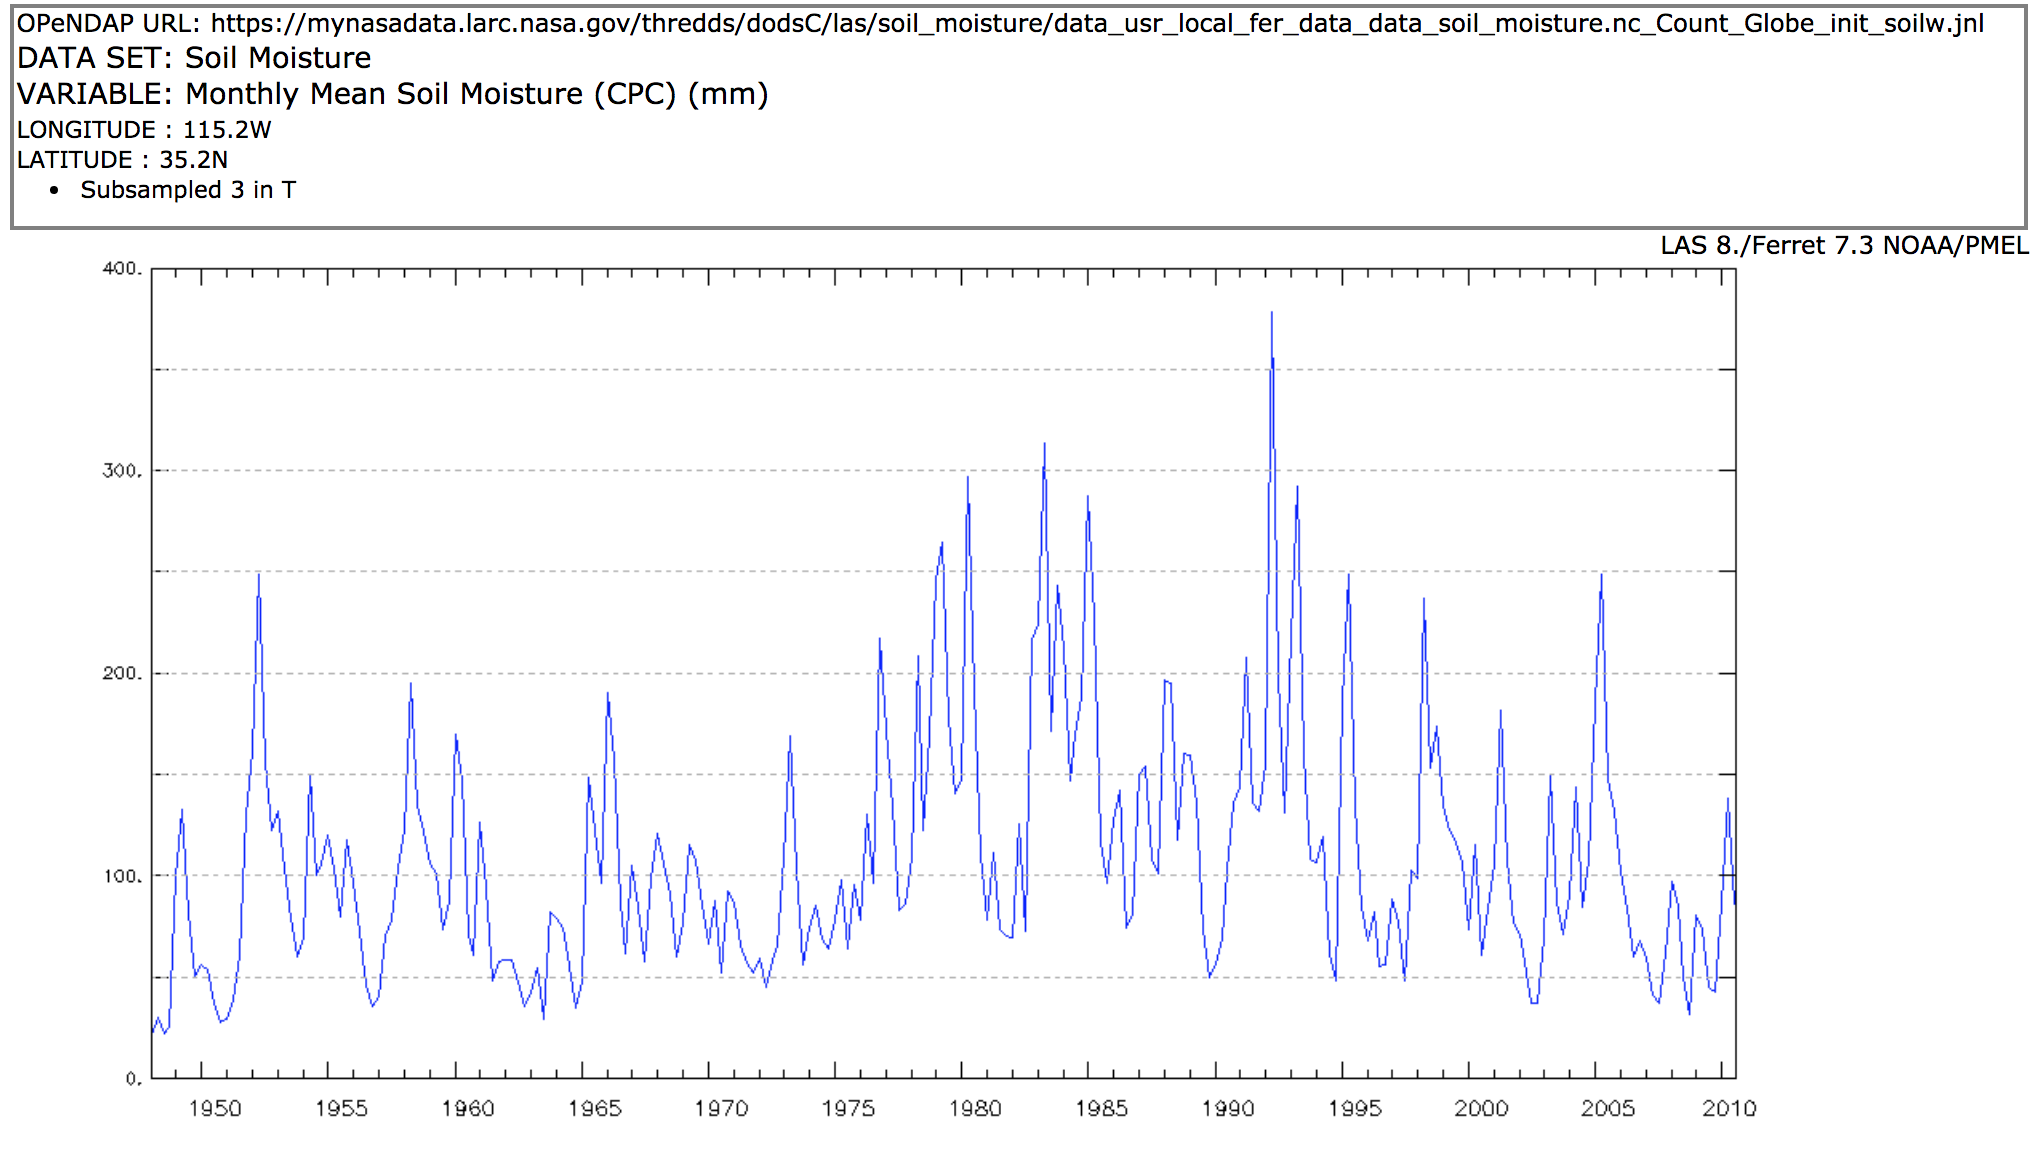
Use the Data Literacy Cube to guide students’ exploration of data to enrich their observations and inferences. This is a flexible resource that may be used with a variety of graphical representations of data. This activity requires a graph for students to evaluate. For the purposes of this lesson, students will analyze a graph of the Monthly Soil Moisture of the Mojave National Preserve, south of Las Vegas, NV shown in mm.
Materials Required
- 1 Cube per group/student
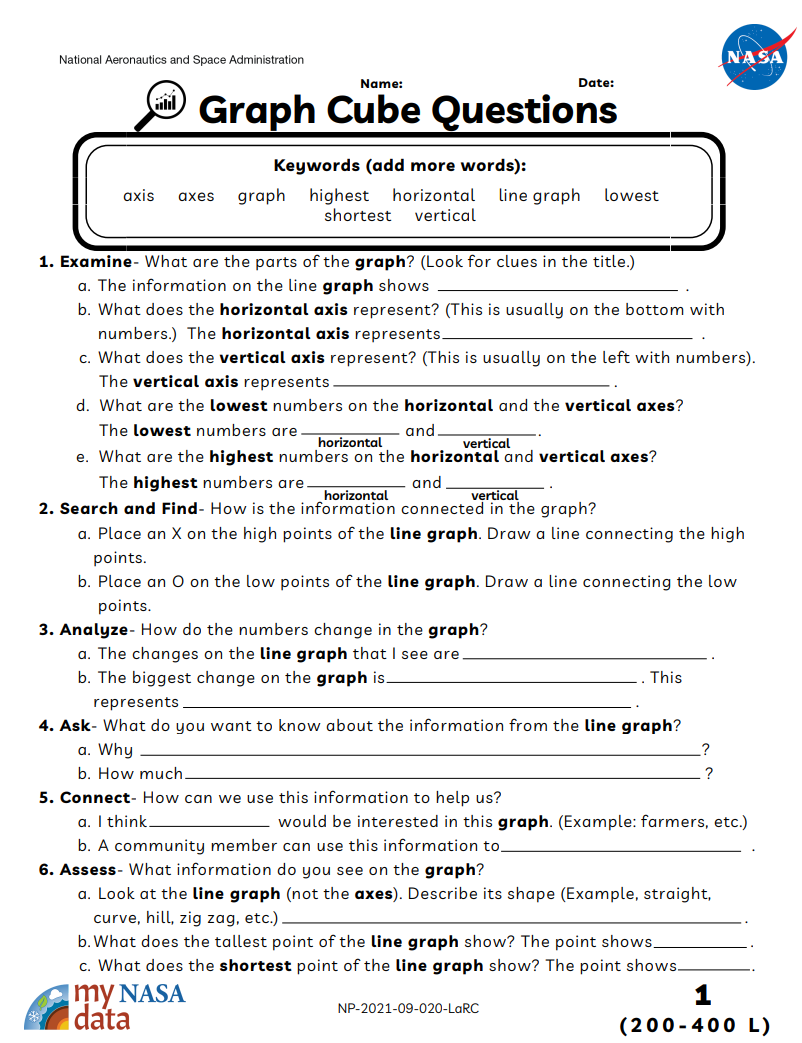
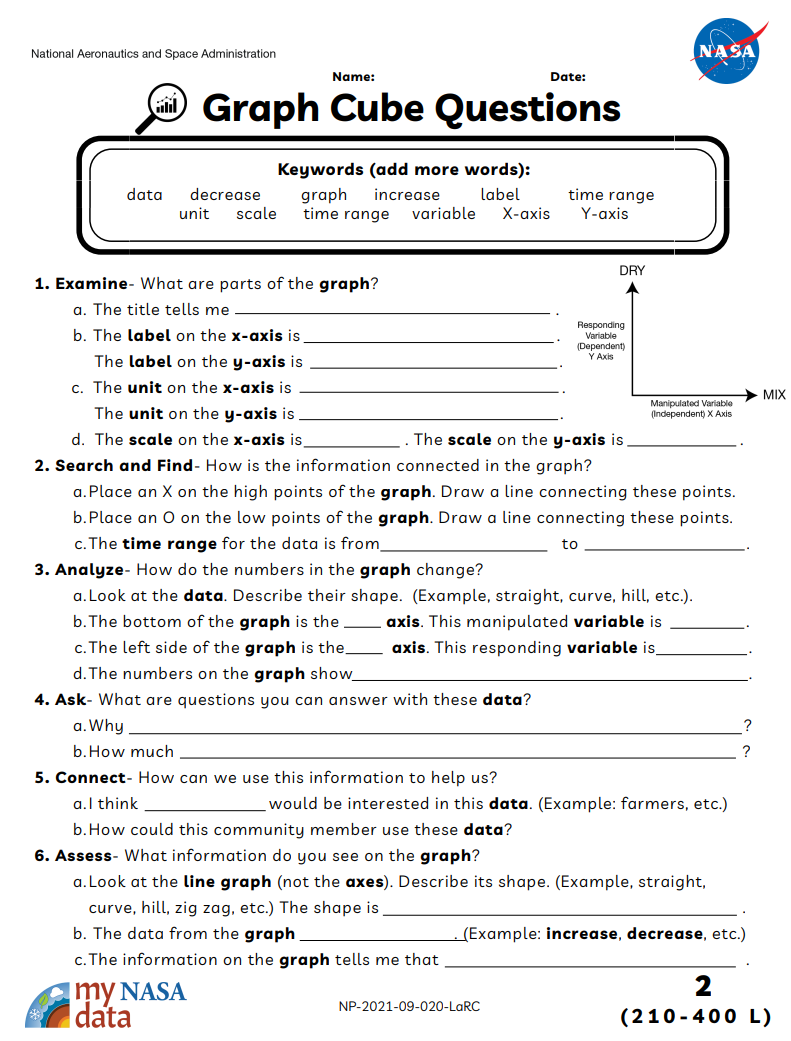
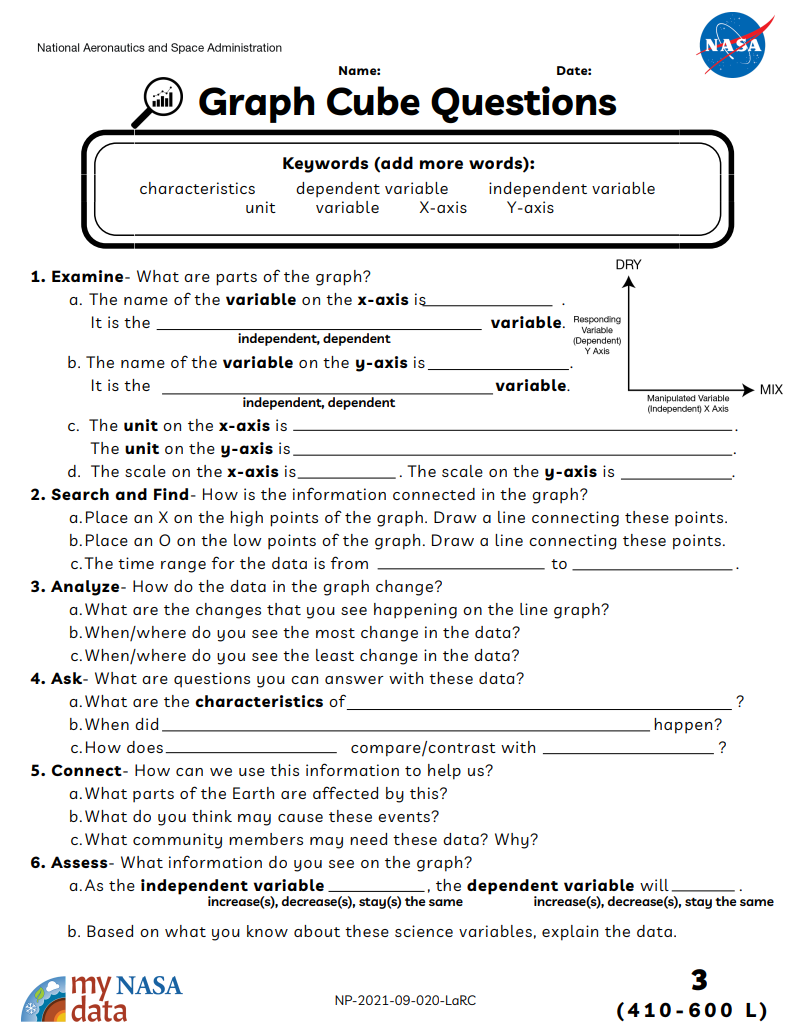
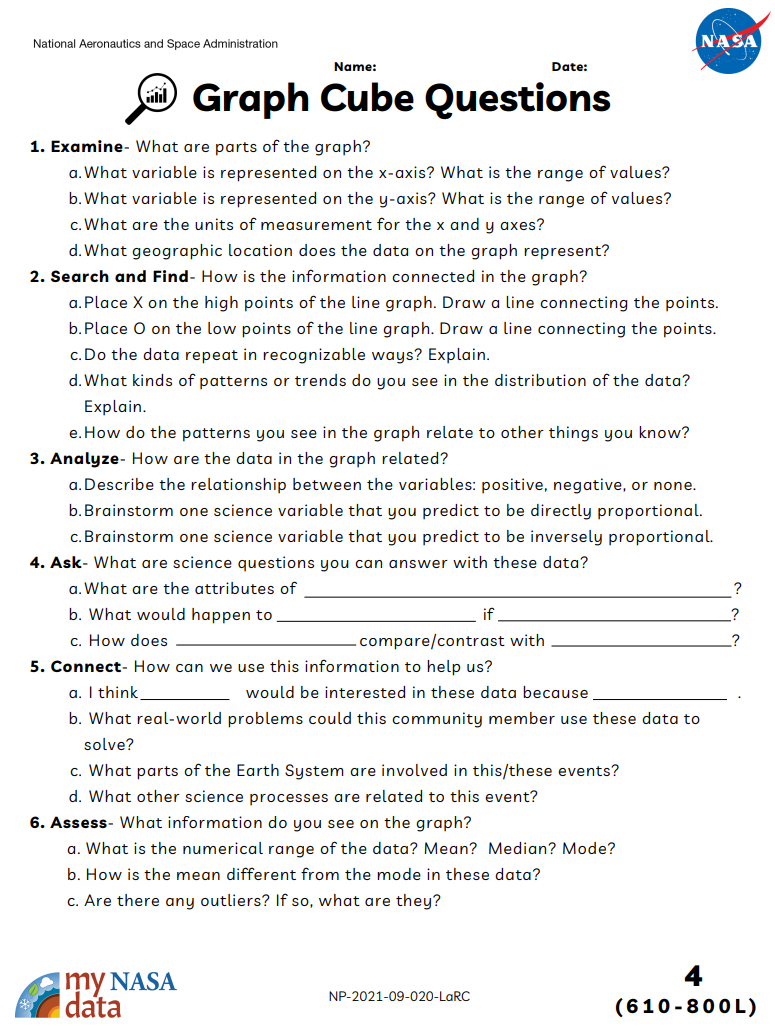
- 1 matching differentiated Graph Question Sheet
- 1 Sheet of paper per student
- Pencil
- Graph
Teacher Preparation:
Print copies of the cube on cardstock and cut out. Assemble the cube with glue. Note: consider laminating after you cut these out for multiple uses. (Gaming dice may be substituted for the cubes.) Also, print off copies of the differentiated Graph Cube Questions. Distribute to students for group or independent work.
Procedure
- Distribute one Cube per group, as well as the related differentiated Graph Cube Questions and the graph.
- Students roll the cube and find the matching question on the Graph Cube Question sheet.
- Answer one question found under matching question on a sheet of paper, labeling the question with the number and letter of the question.
- Repeat Steps 2-4 until at least all 6 are answered.
Disciplinary Core Ideas:
- ESS2D: Weather and Climate
Crosscutting Concepts:
- Scale, Proportion, and Quantity
Science and Engineering Practices:
- Analyzing and Interpreting Data
- Observe and interpret physical characteristics of the Earth System using graphs of NASA data
- Characterize the independent and dependent variables
- Analyze graphs values with statistics
- Research how the phenomena changes of time and space
- Identify relationships among variables
- Summarize trends in the data
- How are the data represented in the graph?
- How do we identify changes in these data?
- How does a change in the independent variable affect the other variable?
- What relationships do you claim exists among these variables?
- Standalone Lesson (no technology required)

Grade Band
- 3-5
- 6-8
Time
- 30 minutes
Visualization Tool
NGSS Three Dimensional Learning
- See drop-down menu at the bottom of the page