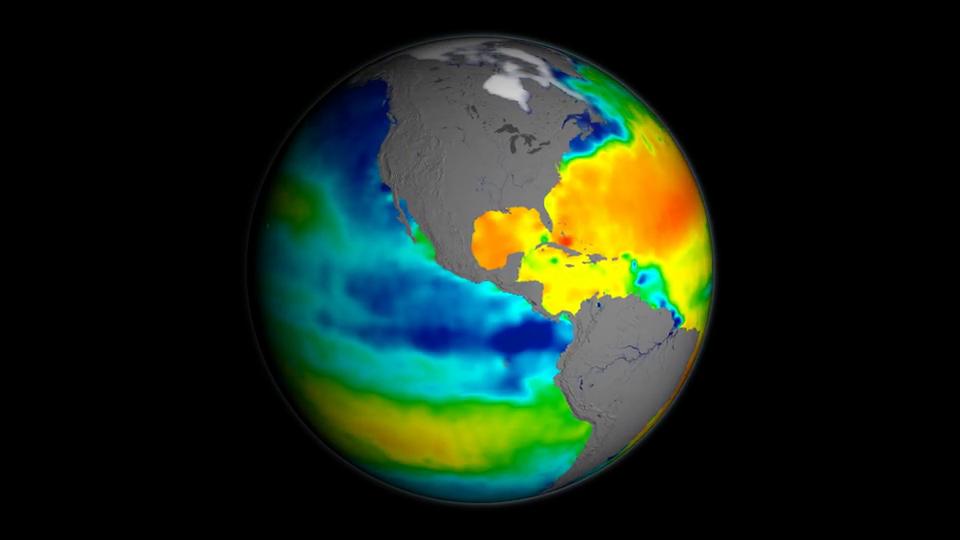
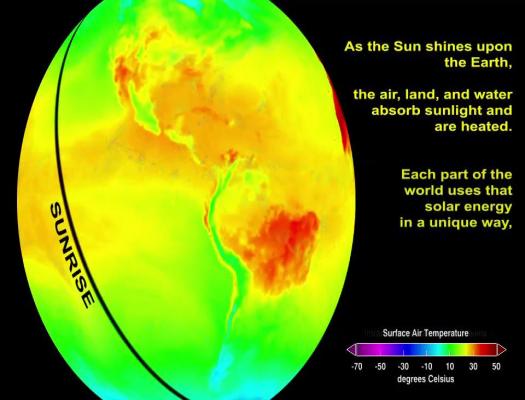
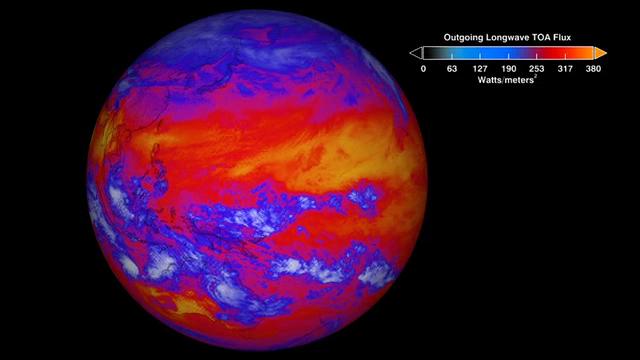
Students review this video showing a global view of the top-of-atmosphere longwave radiation from January 26 and 27, 2012. They review the supporting text and analyze the data in the visualization to answer questions.
loading Earth as a System...
Featured Mini Lesson
This NASA visualization shows sea surface salinity observations (September 2011-September 2014). Students review the video and answer questions.
Students review the NASA video showing biosphere data over the North Atlantic Ocean as a time series animation displaying a decade of phytoplankton blooms and answer questions that follow.
This is the first of a four-part series on the water cycle, which follows the journey of water from the ocean to the atmosphere, to the land, and back again to the ocean. Students review the video and answer questions.
Examine a model and answer questions about dust transport around the world.
Students review a video showing a global view of the top-of-atmosphere shortwave radiation from January 26 and 27, 2012 and answer the questions that follow.
Carbon dioxide concentration in the atmosphere is affected, among other things, by processes involving forests including fires, deforestation and plant respiration. Evaluate a Landsat image to determine the rate of carbon dioxide sequestration in a particular area.
The energy budget diagram on the front shows our best understanding of energy flows into and away from the Earth.
Students observe seasonal images of Monthly Normalized Difference Vegetation, looking for any changes in vegetation that are occurring throughout the year.
The radar measurements made by NASA's Soil Moisture Active Passive (SMAP) observatory are sensitive to whether land surfaces are frozen or thawed. Students analyze two maps of SMAP data to make inferences about changes to the Arctic's Geosphere showing spring thaw.