
Grade Level: 3-5,
6-8,
9-12
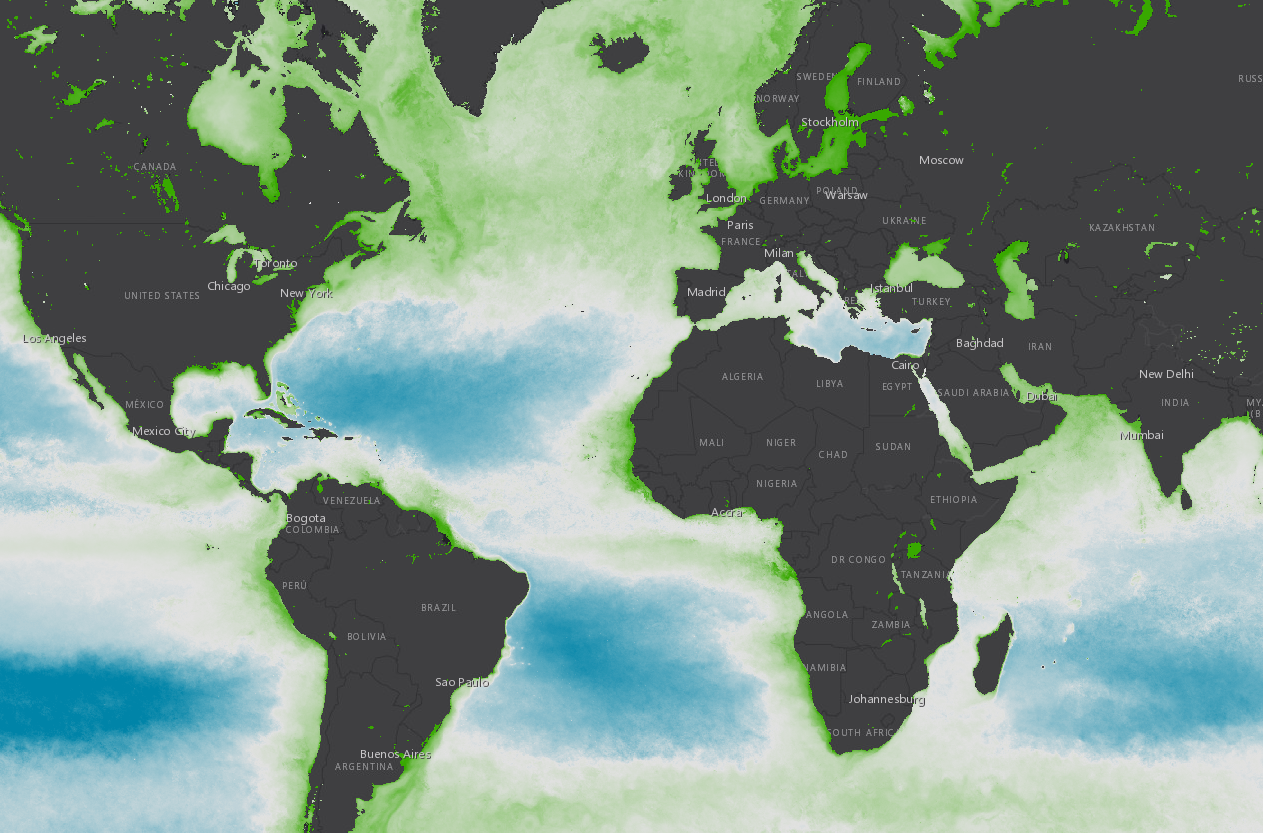
Students identify patterns in chlorophyll concentration data to formulate their explanations of phytoplankton distribution.
Select a Sphere:


Students identify patterns in chlorophyll concentration data to formulate their explanations of phytoplankton distribution.
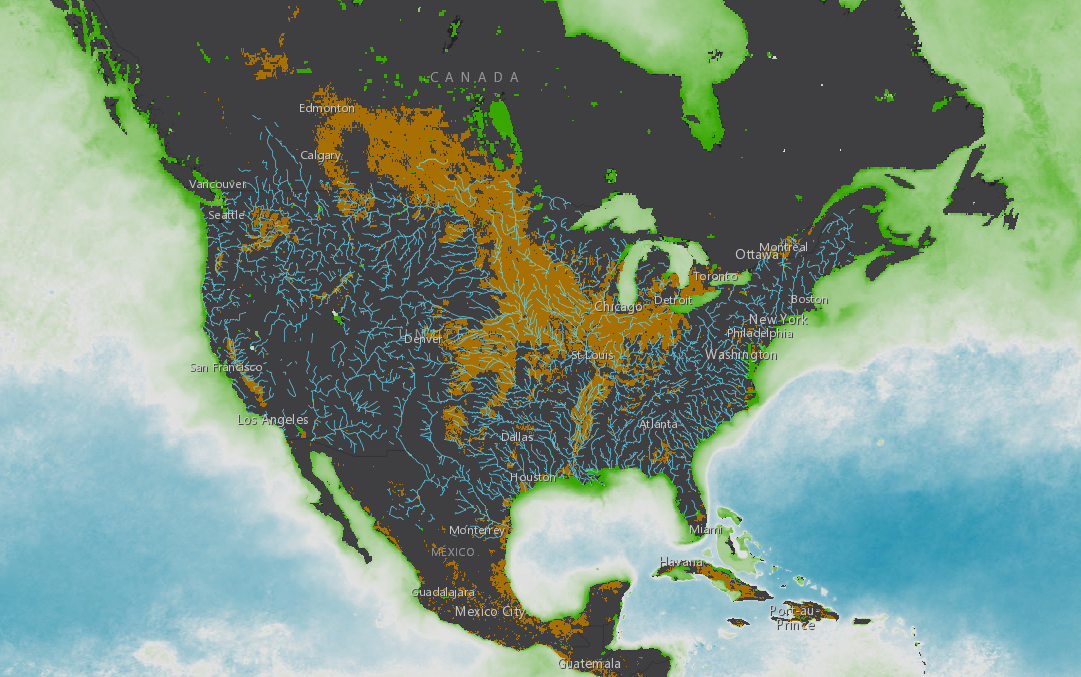
Students will identify and describe the relationship between watersheds and phytoplankton distribution.
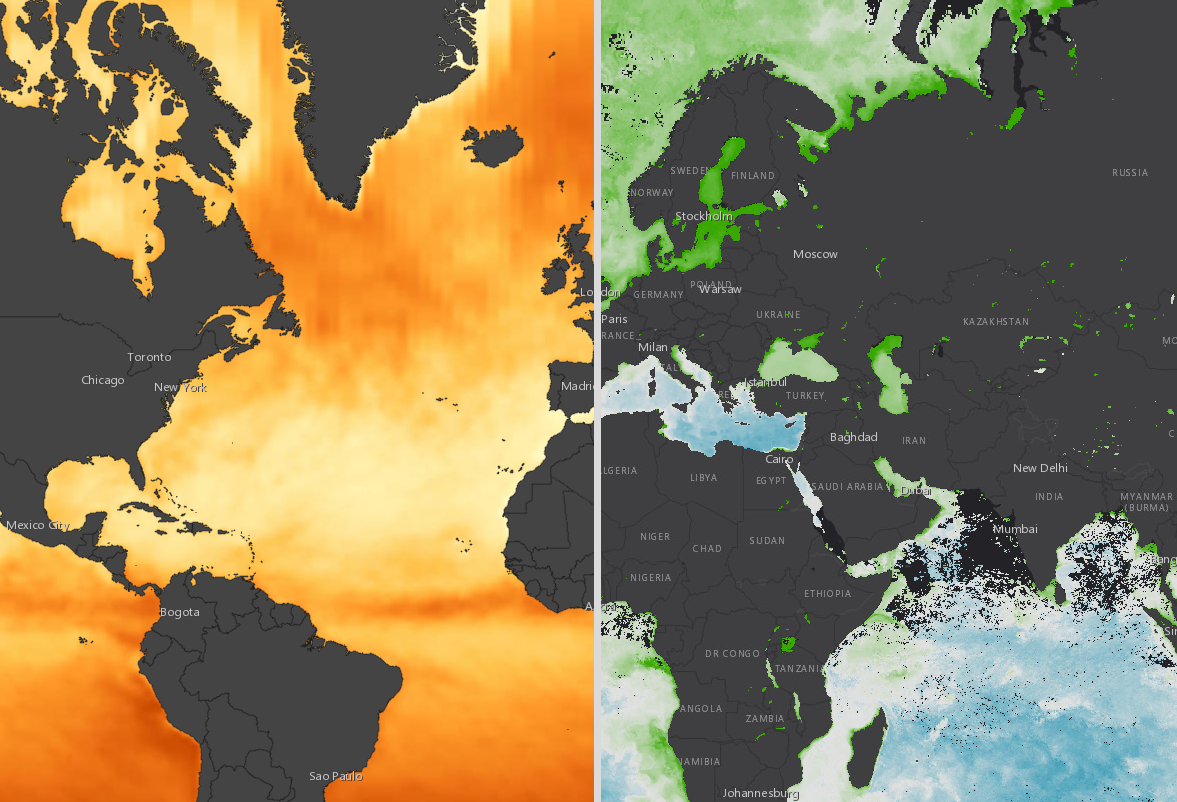
Students identify patterns and describe the relationship between chlorophyll concentration and incoming shortwave radiation.
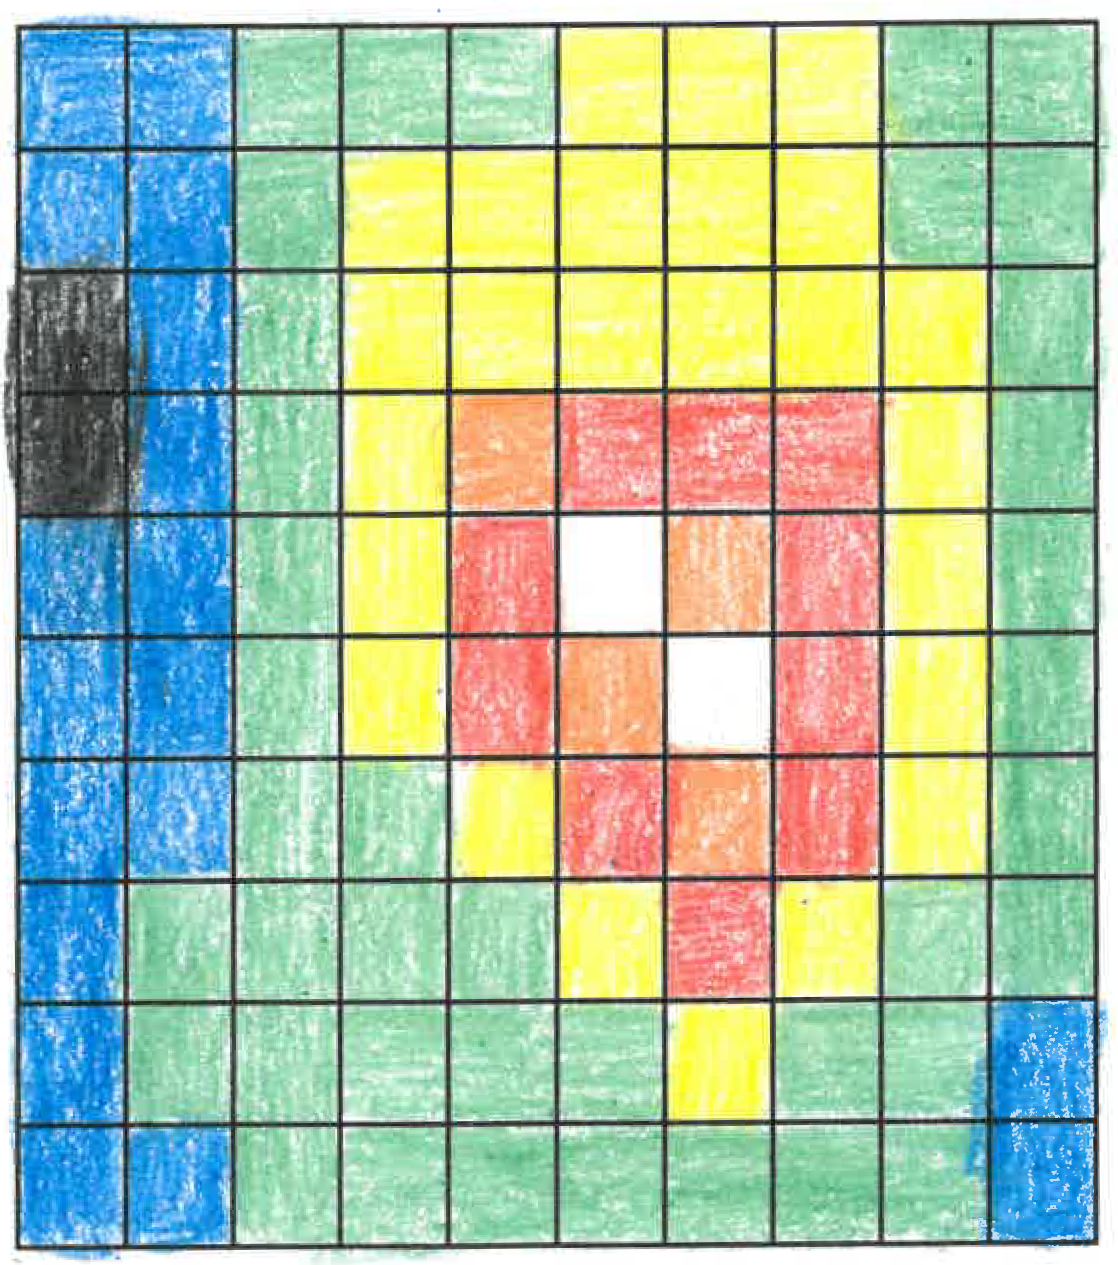
Scientific data are often represented by assigning ranges of numbers to specific colors. The colors are then used to make false color images which allow us to see patterns more easily. Students will make a false-color image using a set of numbers.
Information from satellites if often used to display information about objects. This information can include how things appear, as well as their contents. Explore how pixel data sequences can be used to create an image and interpret it.

Using various visualizations (i.e., images, charts, and graphs), students will explore the energy exchange that occurs when hurricanes extract heat energy from the ocean. This StoryMap is intended to be used with students who have access to the internet in a 1:1 or 1:2 setting.
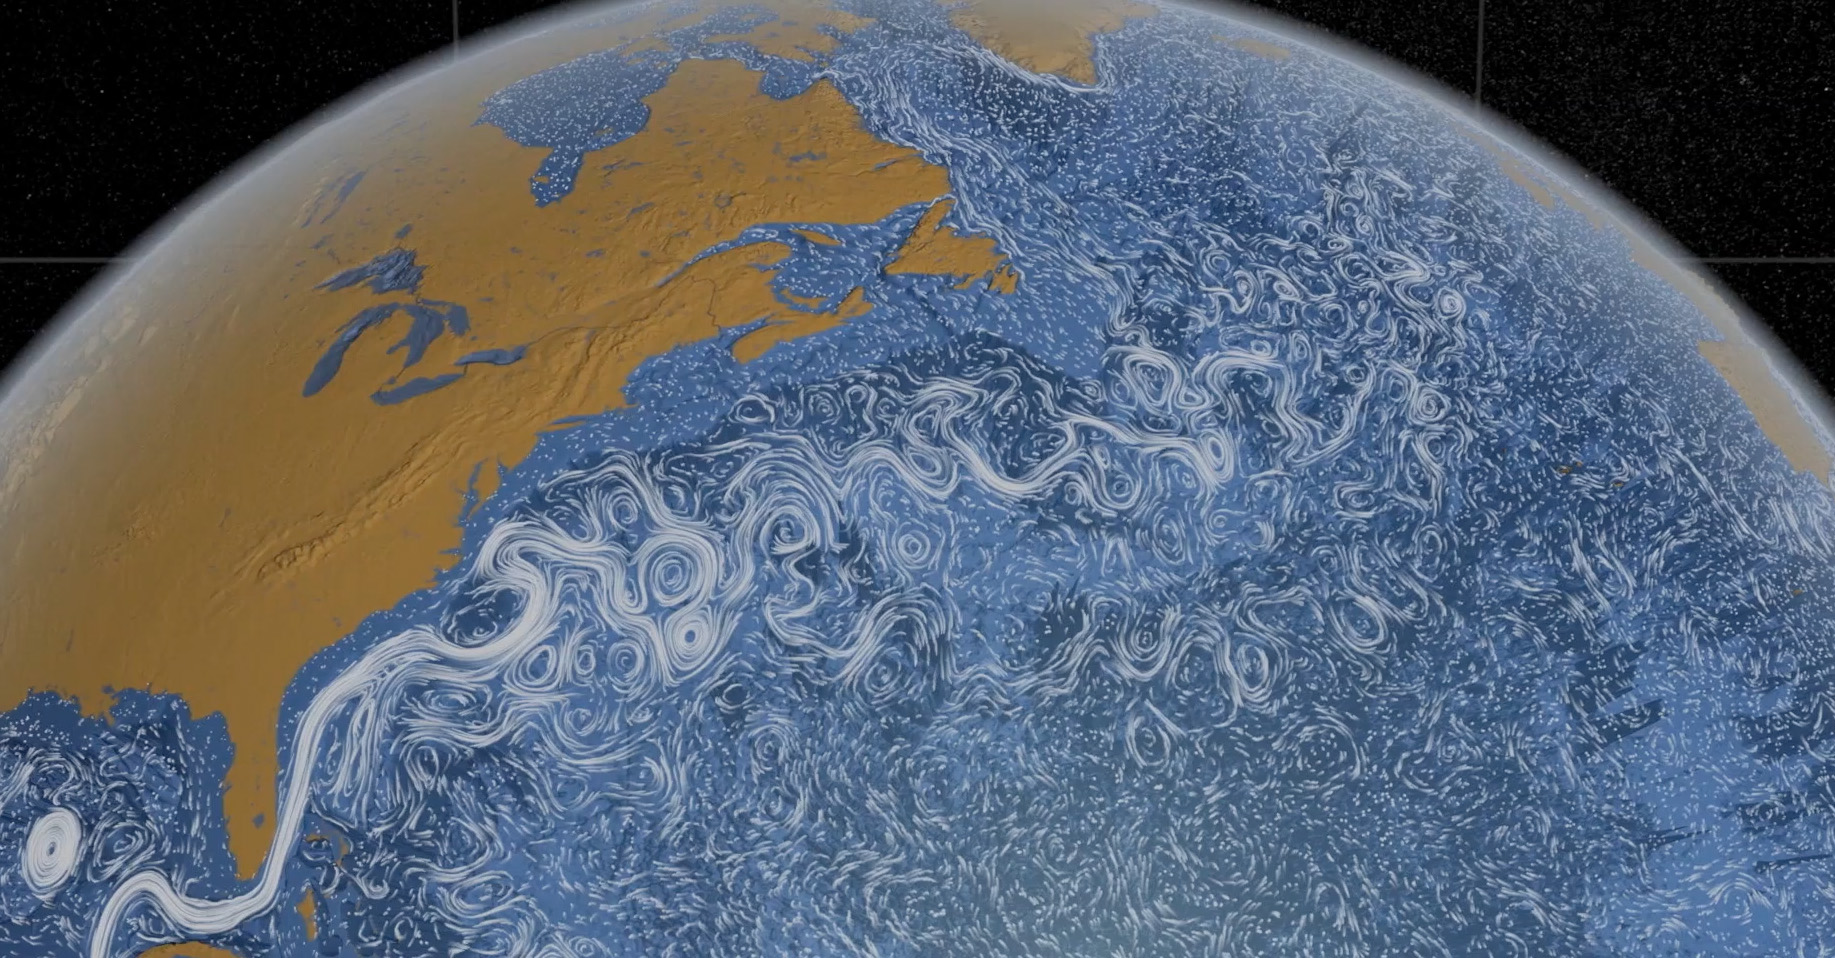
This StoryMap lesson plan allows students to explore ocean circulation patterns as they relate to the world's ocean garbage patches using NASA ocean currents data.
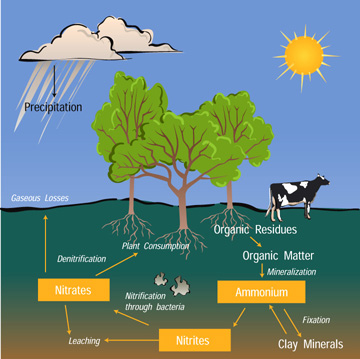
Students will explore the Nitrogen Cycle by modeling the movement of a nitrogen atom as it passes through the cycle. Students will stop in the different reservoirs along the way, answering questions about the processes that brought them to the different reservoirs.

