
Grade Level: 6-8
Students explore the spatial patterns observed in meteorological data and learn how this information is used to predict weather and understand climate behavior.
Ice, which covers 10 percent of Earth's surface, is disappearing rapidly. While the Arctic sea ice extent is declining, air temperatures are rising. Vegetation is changing, with tundra being replaced by shrubs. Permafrost is warming and thawing over parts of the Arctic. Some of these changes, such as the replacement of white reflective sea ice with dark open water, set in motion feedbacks that contribute to even further warming. As the Arctic warms, some animal species are finding the region more hospitable, while others are seeing declines in their habitat. The recent changes in the Arctic region have important impacts for regions outside of the Arctic and for the global climate.

Students explore the spatial patterns observed in meteorological data and learn how this information is used to predict weather and understand climate behavior.
This mini lesson helps students visualize how the Hydrosphere and Cryosphere interact to produce changes in land and sea ice.


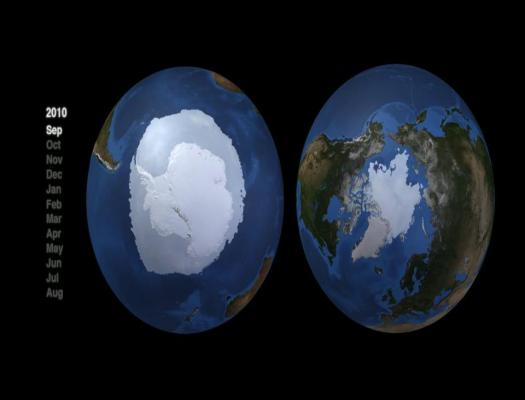
The advance-and-retreat cycle of snow cover drastically changes the whiteness and brightness of Earth. Using two maps created using NASA satellite data for 2017, students review the seasonal differences of snow and ice extent and answer questions on their observations.

Arctic sea ice is the cap of frozen seawater blanketing most of the Arctic Ocean and neighboring seas in wintertime. It follows seasonal patterns of thickening and melting. Students view how the quantity has changed from 1979 through 2018.


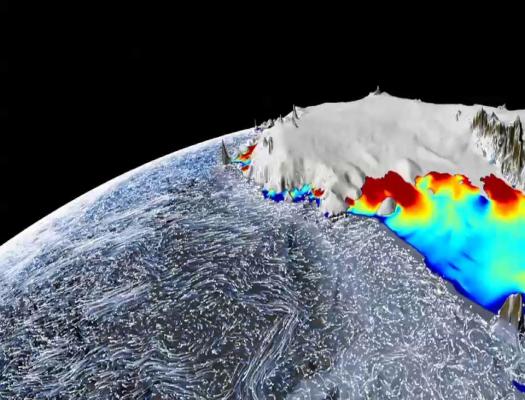
Students examine the two time series images to determine the differences between seasonal ice melt over water versus land.
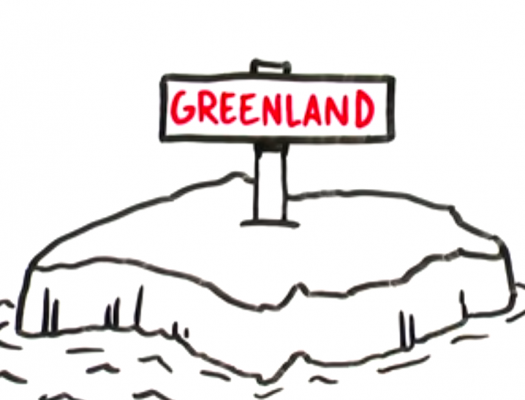
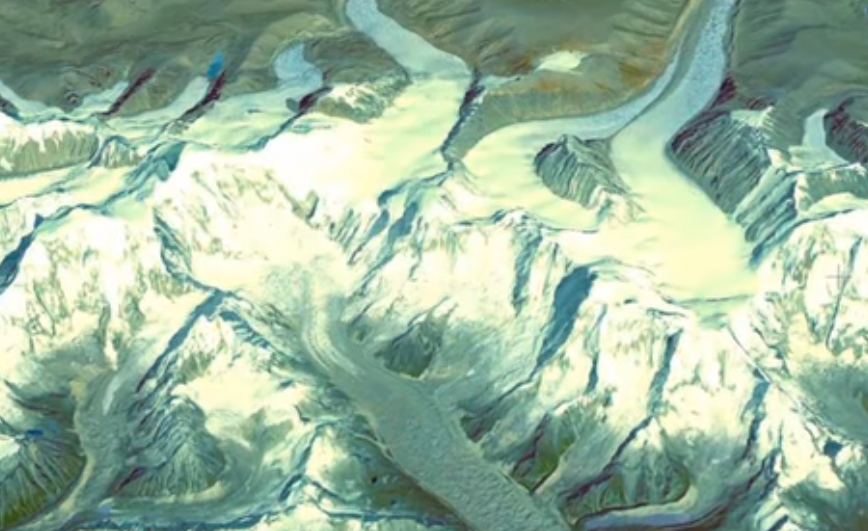
Students will watch a video on the Greenland Ice Sheet and answer questions.

Students watch the video Frozen Earth and answer the following questions that discuss how ice helps moderate the planet's temperature using NASA satellites.

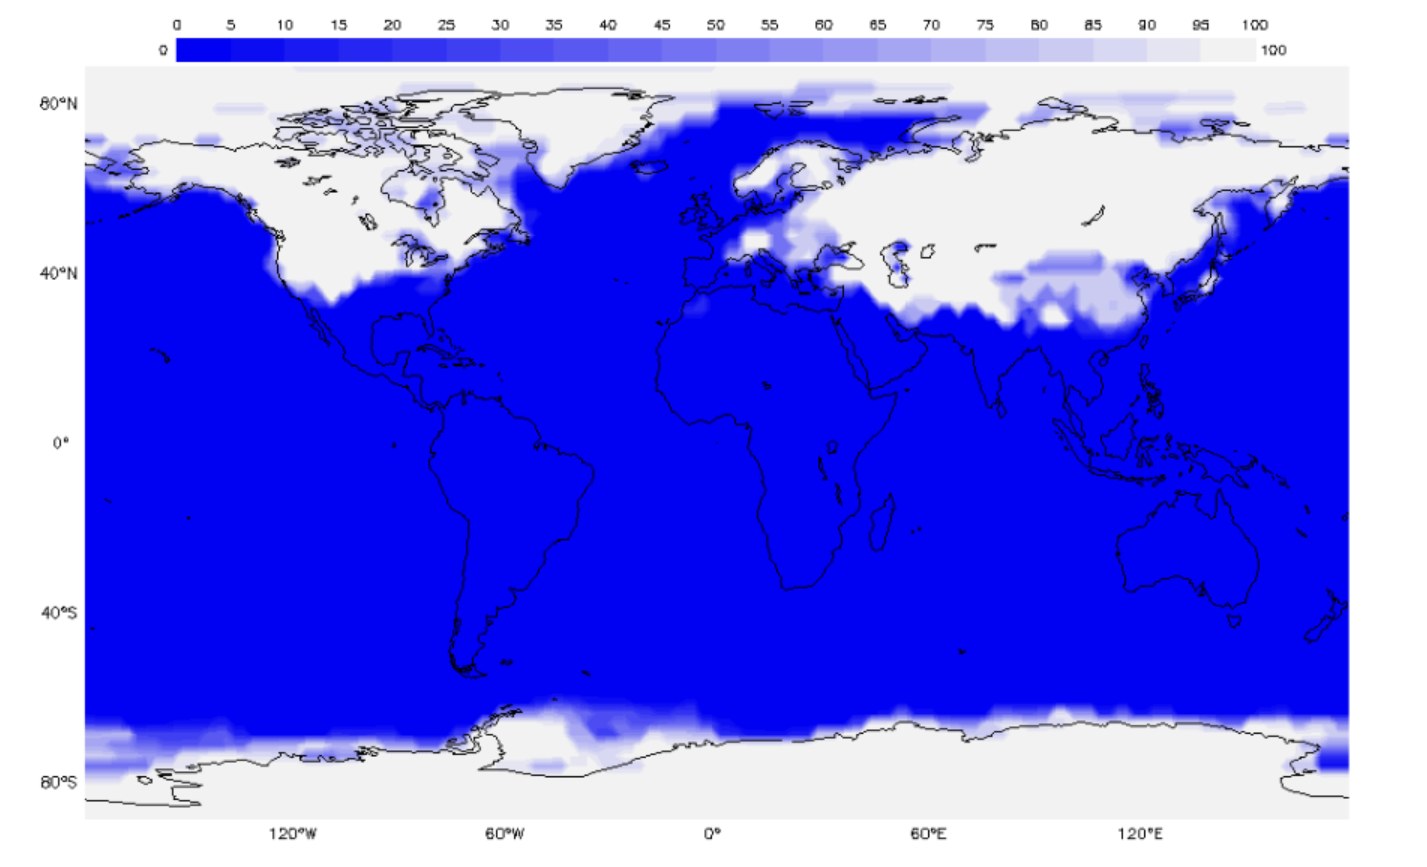
Students analyze two North Pole orthographic data visualizations produced from soil moisture data.
Students explore the spatial patterns observed in meteorological data and learn how this information is used to predict weather and understand climate behavior.

This mini lesson helps students visualize how the Hydrosphere and Cryosphere interact to produce changes in land and sea ice.
The advance-and-retreat cycle of snow cover drastically changes the whiteness and brightness of Earth. Using two maps created using NASA satellite data for 2017, students review the seasonal differences of snow and ice extent and answer questions on their observations.
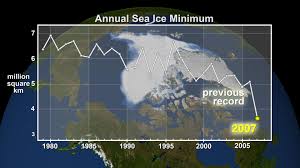
Arctic sea ice is the cap of frozen seawater blanketing most of the Arctic Ocean and neighboring seas in wintertime. It follows seasonal patterns of thickening and melting. Students view how the quantity has changed from 1979 through 2018.
Students examine the two time series images to determine the differences between seasonal ice melt over water versus land.

Students will watch a video on the Greenland Ice Sheet and answer questions.
Students watch the video Frozen Earth and answer the following questions that discuss how ice helps moderate the planet's temperature using NASA satellites.

Students analyze two North Pole orthographic data visualizations produced from soil moisture data.

