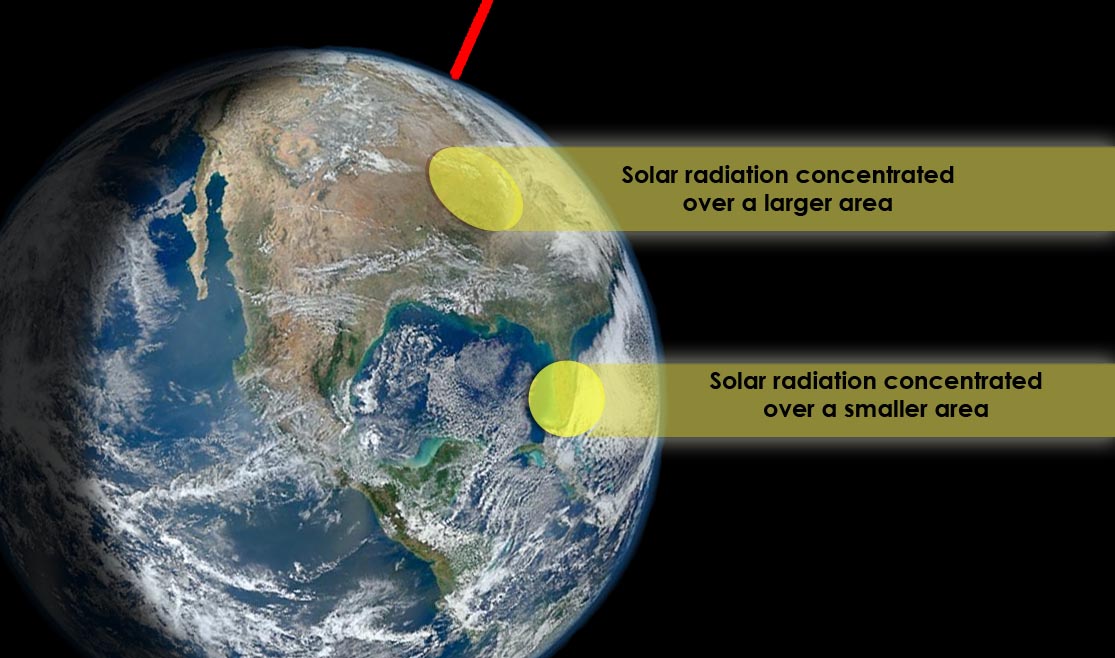
Students will analyze surface temperature and solar radiation data to construct explanations about the relationship of seasons and temperature to the amount of solar energy received on Earth’s surface.
List of all Atmosphere Lesson Plans


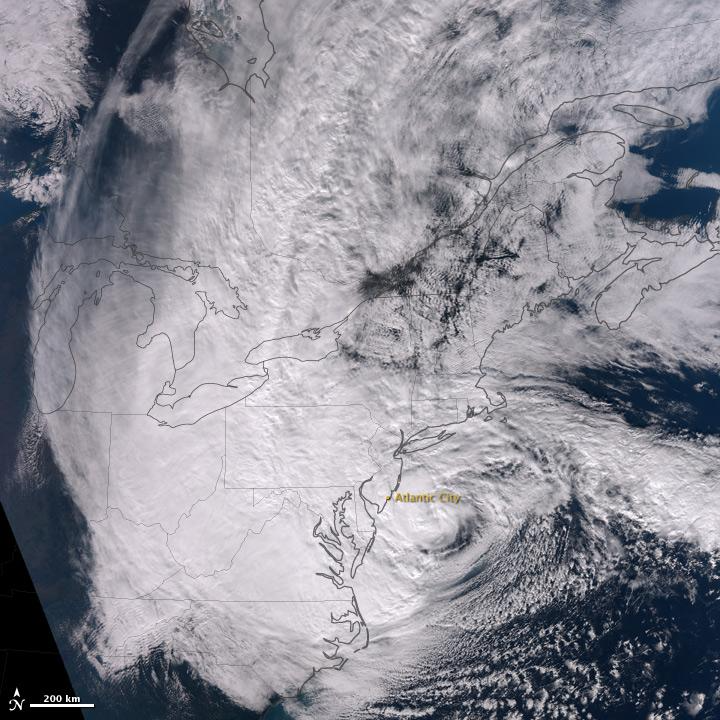
Students investigate the effects of Hurricane Sandy and make a scale model of the storm over the continental United States to assess the area of impact.
Examine (daytime) surface temperature and solar radiation received at locations found near similar latitudes using NASA Data.
Students will analyze and interpret graphs to compare the flow of (shortwave) energy from the Sun toward China over the course of a year on cloudy versus clear days. Students will draw a conclusion and support it with evidence.
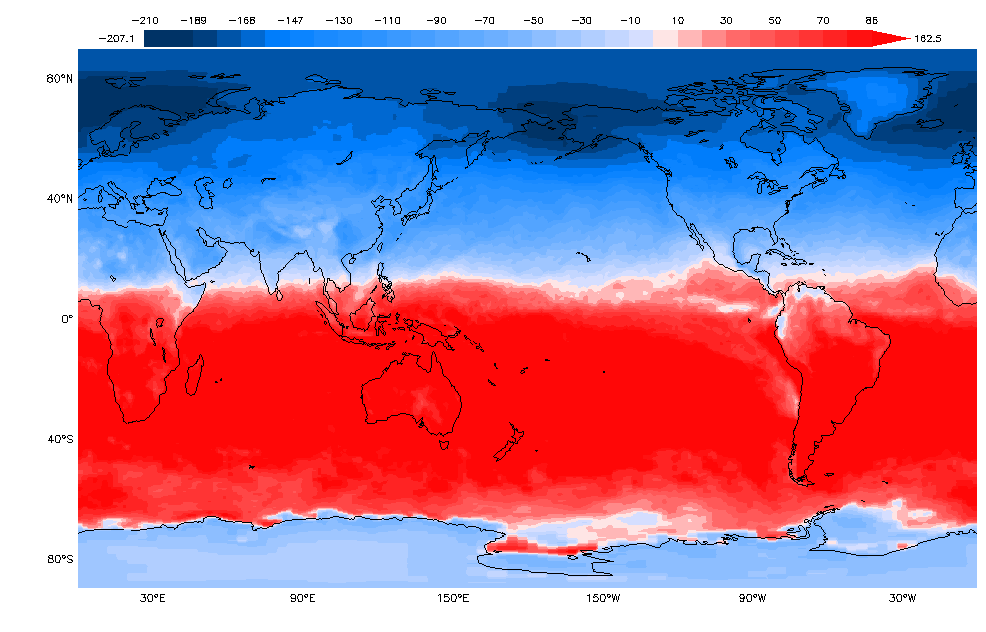
Students will analyze and interpret maps of the average net atmospheric radiation to compare the flow of energy from the Sun toward Earth in different months and for cloudy versus clear days. Students will draw conclusions and support them with evidence.
The activities in this guide will help students understand variations in environmental parameters by examining connections among different phenomena measured on local, regional and global scales.
Students will practice the process of making claims, collecting evidence to support claims, and applying scientific reasoning to connect evidence to claims.
Students move through a series of short activities to explore and evaluate global solar radiation data from NASA satellites. In this process, students make qualitative and quantitative observations about seasonal variations in net energy input to the Earth System.
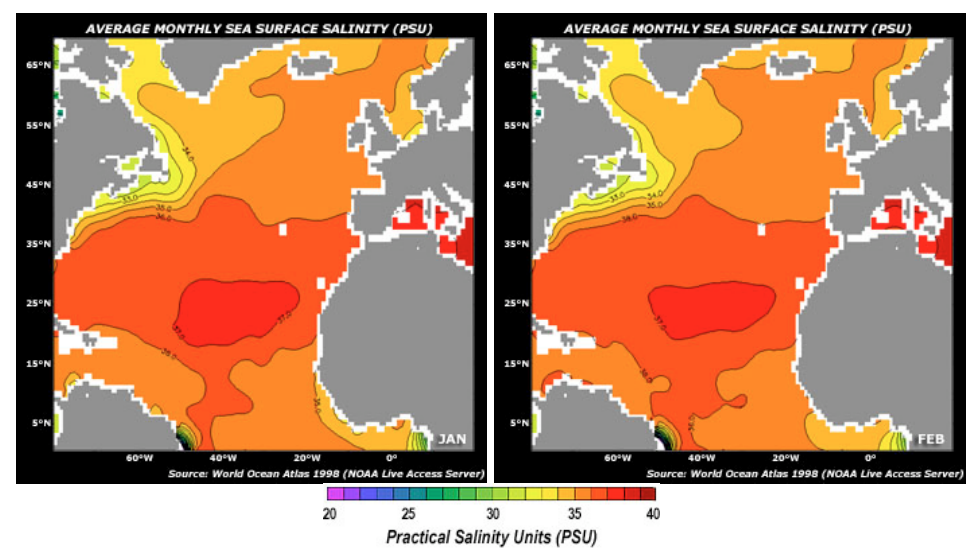
Students will observe monthly satellite data of the North Atlantic to identify relationships among key science variables that include sea surface salinity (SS), air temperature at the ocean surface (AT), sea surface temperature (ST), evaporation (EV), precipitation (PT), and evaporation minus pre
Students review Earth System phenomena that are affected by soil moisture. They analyze and evaluate maps of seasonal global surface air temperature and soil moisture data from NASA satellites. Building from their observations, students will select a location in the U.S.


