


Grade Level: 6-8,
9-12
Use the Earth System Data Explorer to analyze data and make a claim about which 2018 eruption was larger, Kilauea, HI or Ambae Island, Vanuatu.
Select a Sphere:


Use the Earth System Data Explorer to analyze data and make a claim about which 2018 eruption was larger, Kilauea, HI or Ambae Island, Vanuatu.
Students collect and analyze temperature data to explore what governs how much energy is reflected.
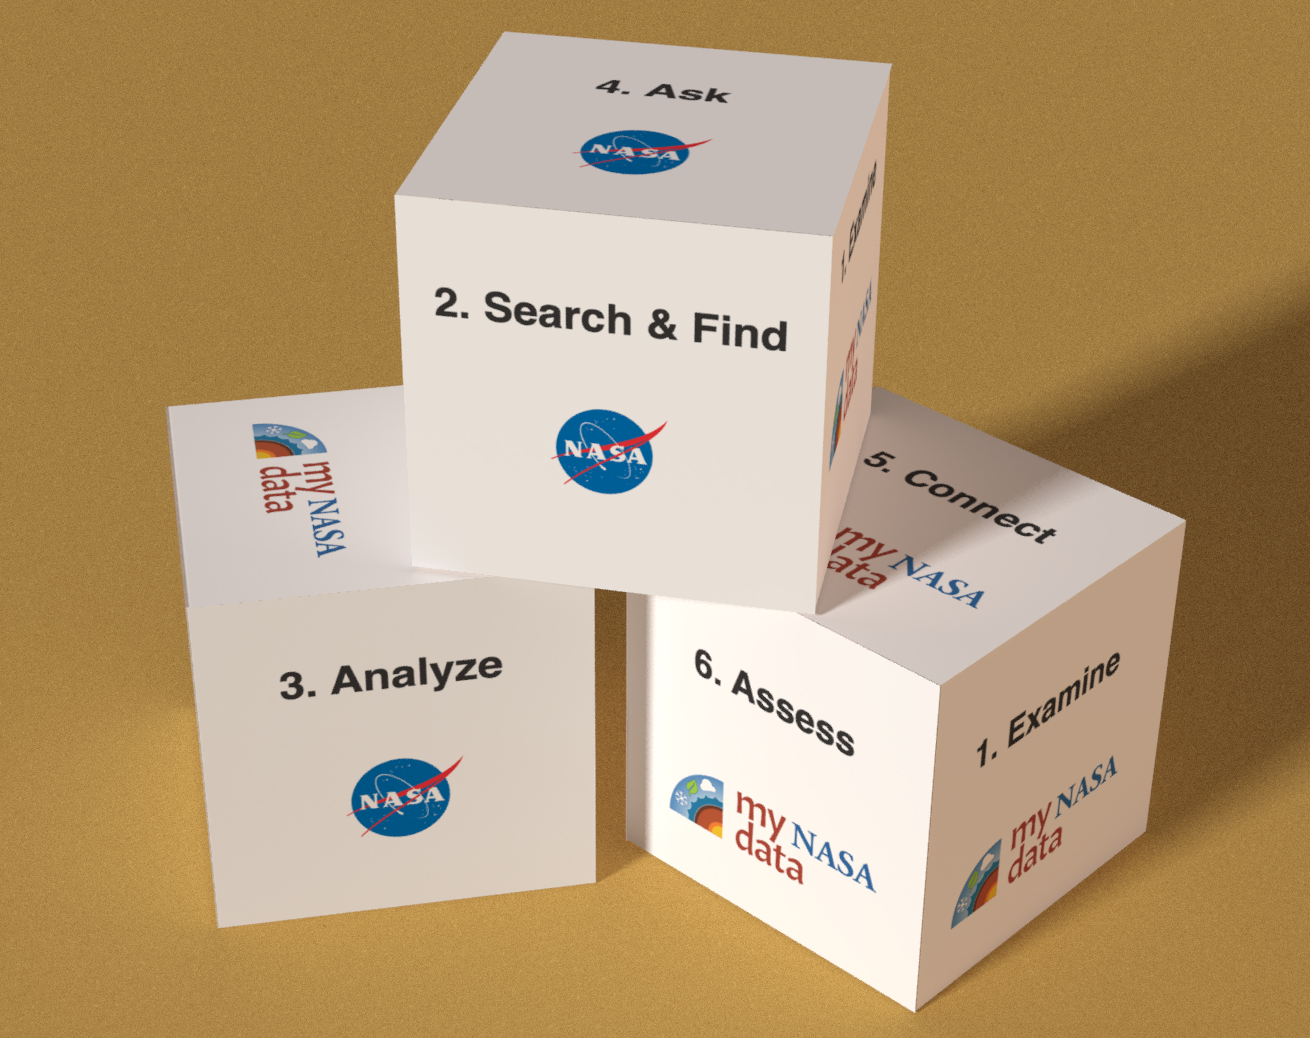
This Lesson Plan provides maps, graphs, and data tables for use with the Data Literacy Cubes. Because it is a differentiated resource, it is appropriate for multiple grade bands.
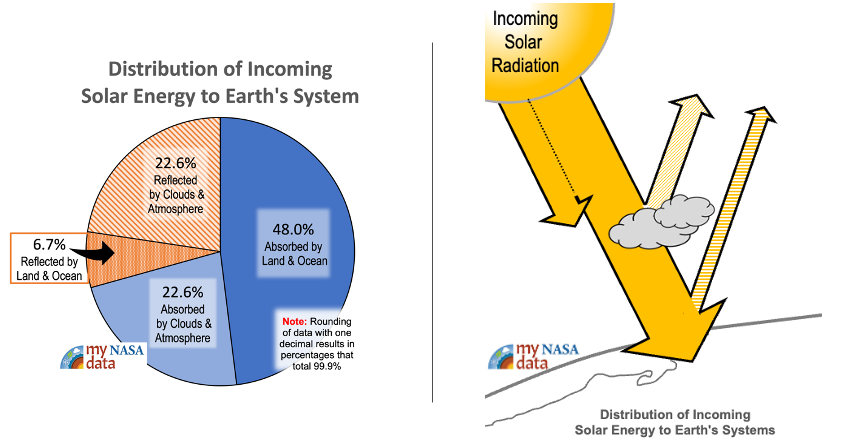
A kinesthetic activity that challenges students to participate in a model that describes the fate of solar energy as it enters the Earth system. A good initial lesson for Earth’s energy budget, students unravel the benefits and limitations of their model.
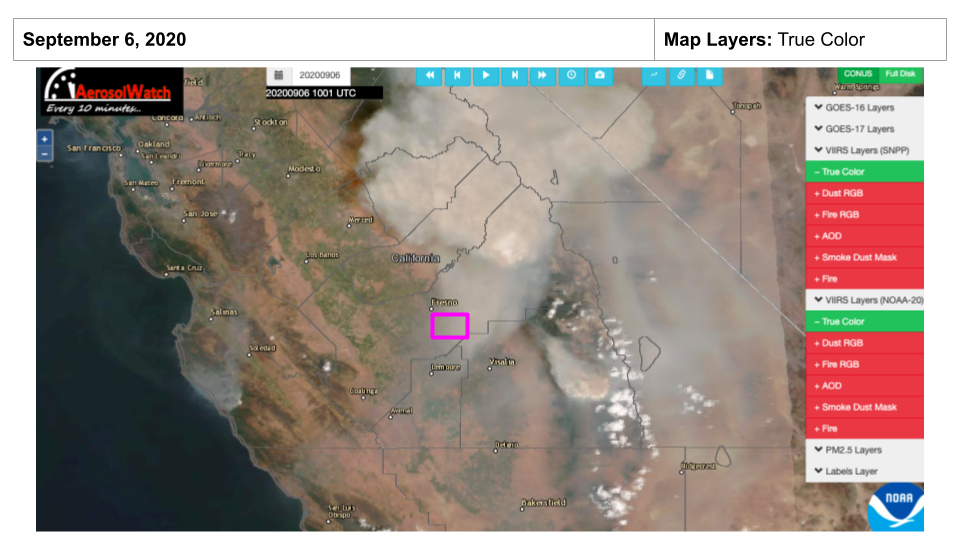
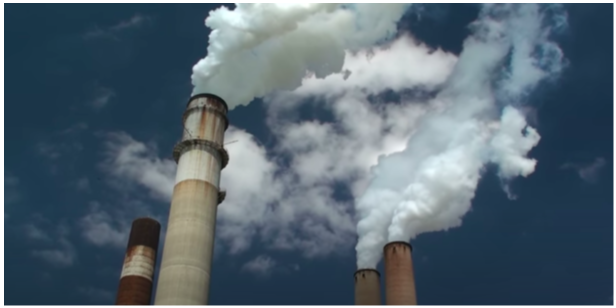
In this 5E’s lesson, students observe maps that show smoke and AOD levels surrounding Fresno, California at the time when the 2020 Creek Fire was burning. Students construct a claim that identifies a relationship between fire-related data and air quality data.
Students will examine how radiation, conduction, and convection work together as a part of Earth’s Energy Budget to heat the atmosphere.
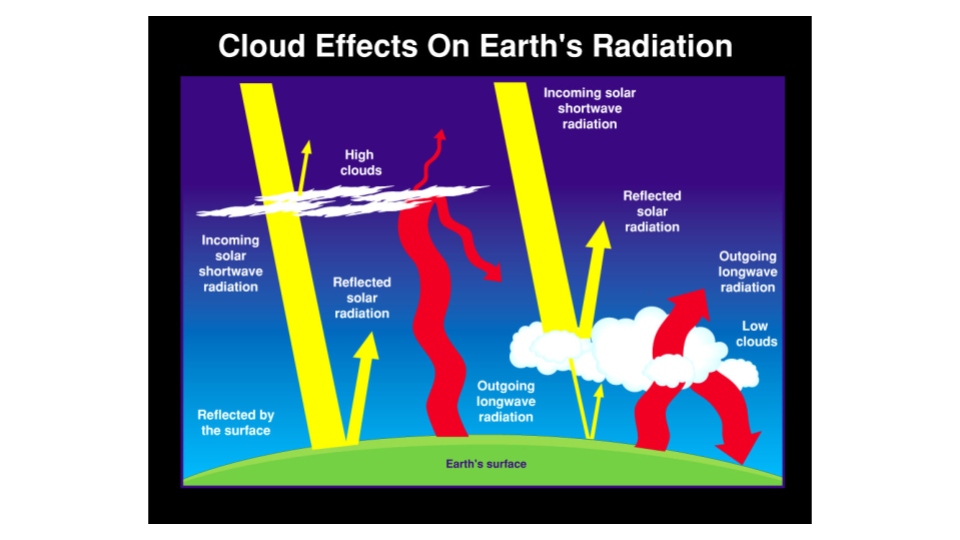
Students will investigate the role of clouds and their contribution (if any) to global warming. Working in cooperative groups, students will make a claim about the future role clouds will play in Earth’s Energy Budget if temperatures continue to increase.
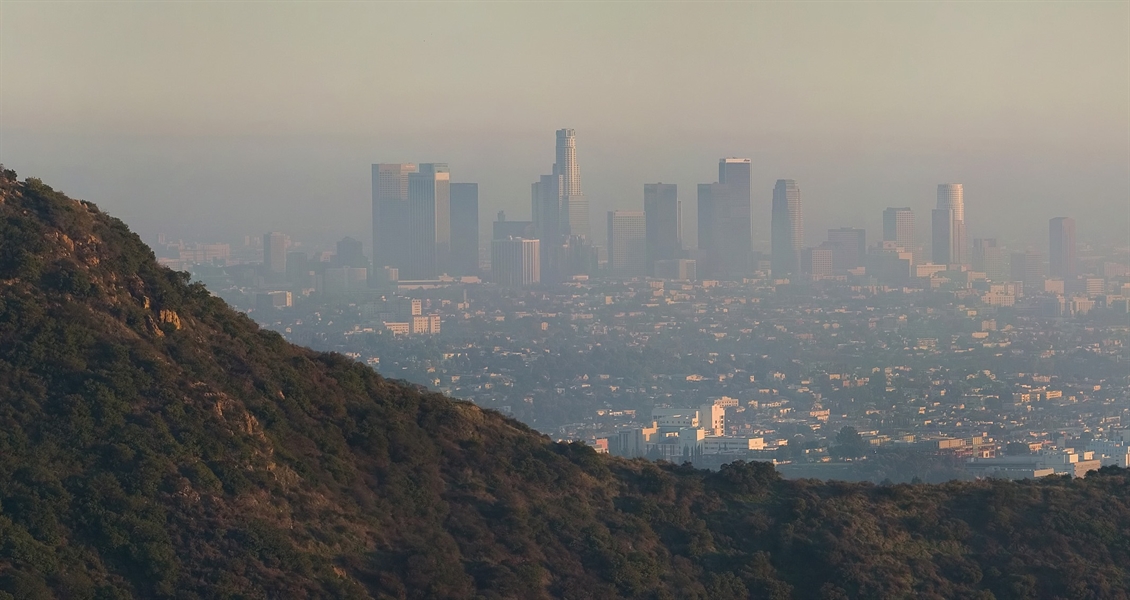
In this 5Es lesson, students will uncover how changes in global air quality have impacted human health in cities between 2000 and 2019.
Students synthesize information from My NASA Data maps and texts from the EPA website to determine how levels of criteria pollutants have changed from 2005 to 2021. This research will prepare them to respond to the lesson’s essential questions during a Socratic seminar.
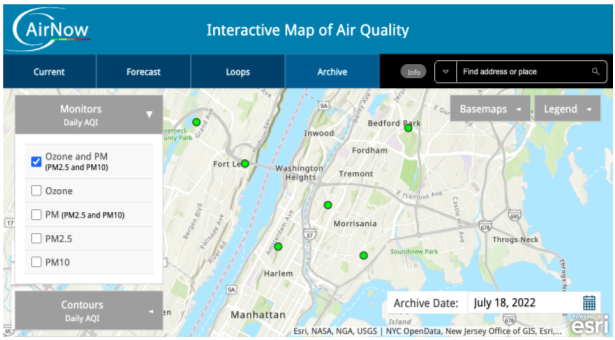
Students interpret AQI maps and charts to compare today’s AQI with the past five days. Using the EPA’s air quality activity guides, students create a social media post for residents of their region providing key information related to today’s AQI.
These NASA lessons support Next Generation Science Standards (NGSS) and three dimensional learning of the Earth System. These include activities where students interact with NASA maps, graphs, and datasets from the atmosphere, biosphere, cryosphere, geosphere, hydrosphere and the earth system.