List of all Atmosphere Lesson Plans

Select a Sphere:

color atmosphere icon
Atmosphere
black biosphere icon
Biosphere
black cryosphere icon
Cryosphere
black geosphere icon
Geosphere
black hydrosphere icon
Hydrosphere
earth systems icon
Earth as a System


Select a Grade Band:
all grade icon
3-12
elementary grade icon
3-5
middle grade icon
6-8
high grade icon
9-12
Grade Level: 9-12

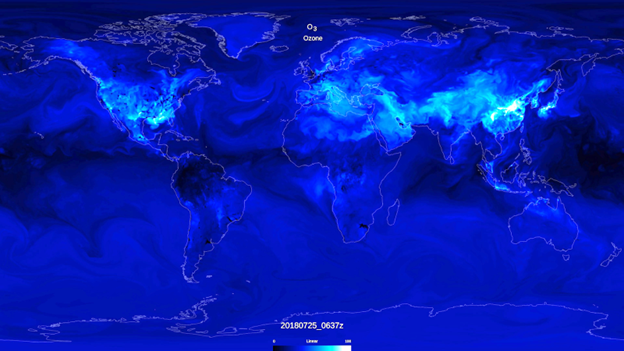
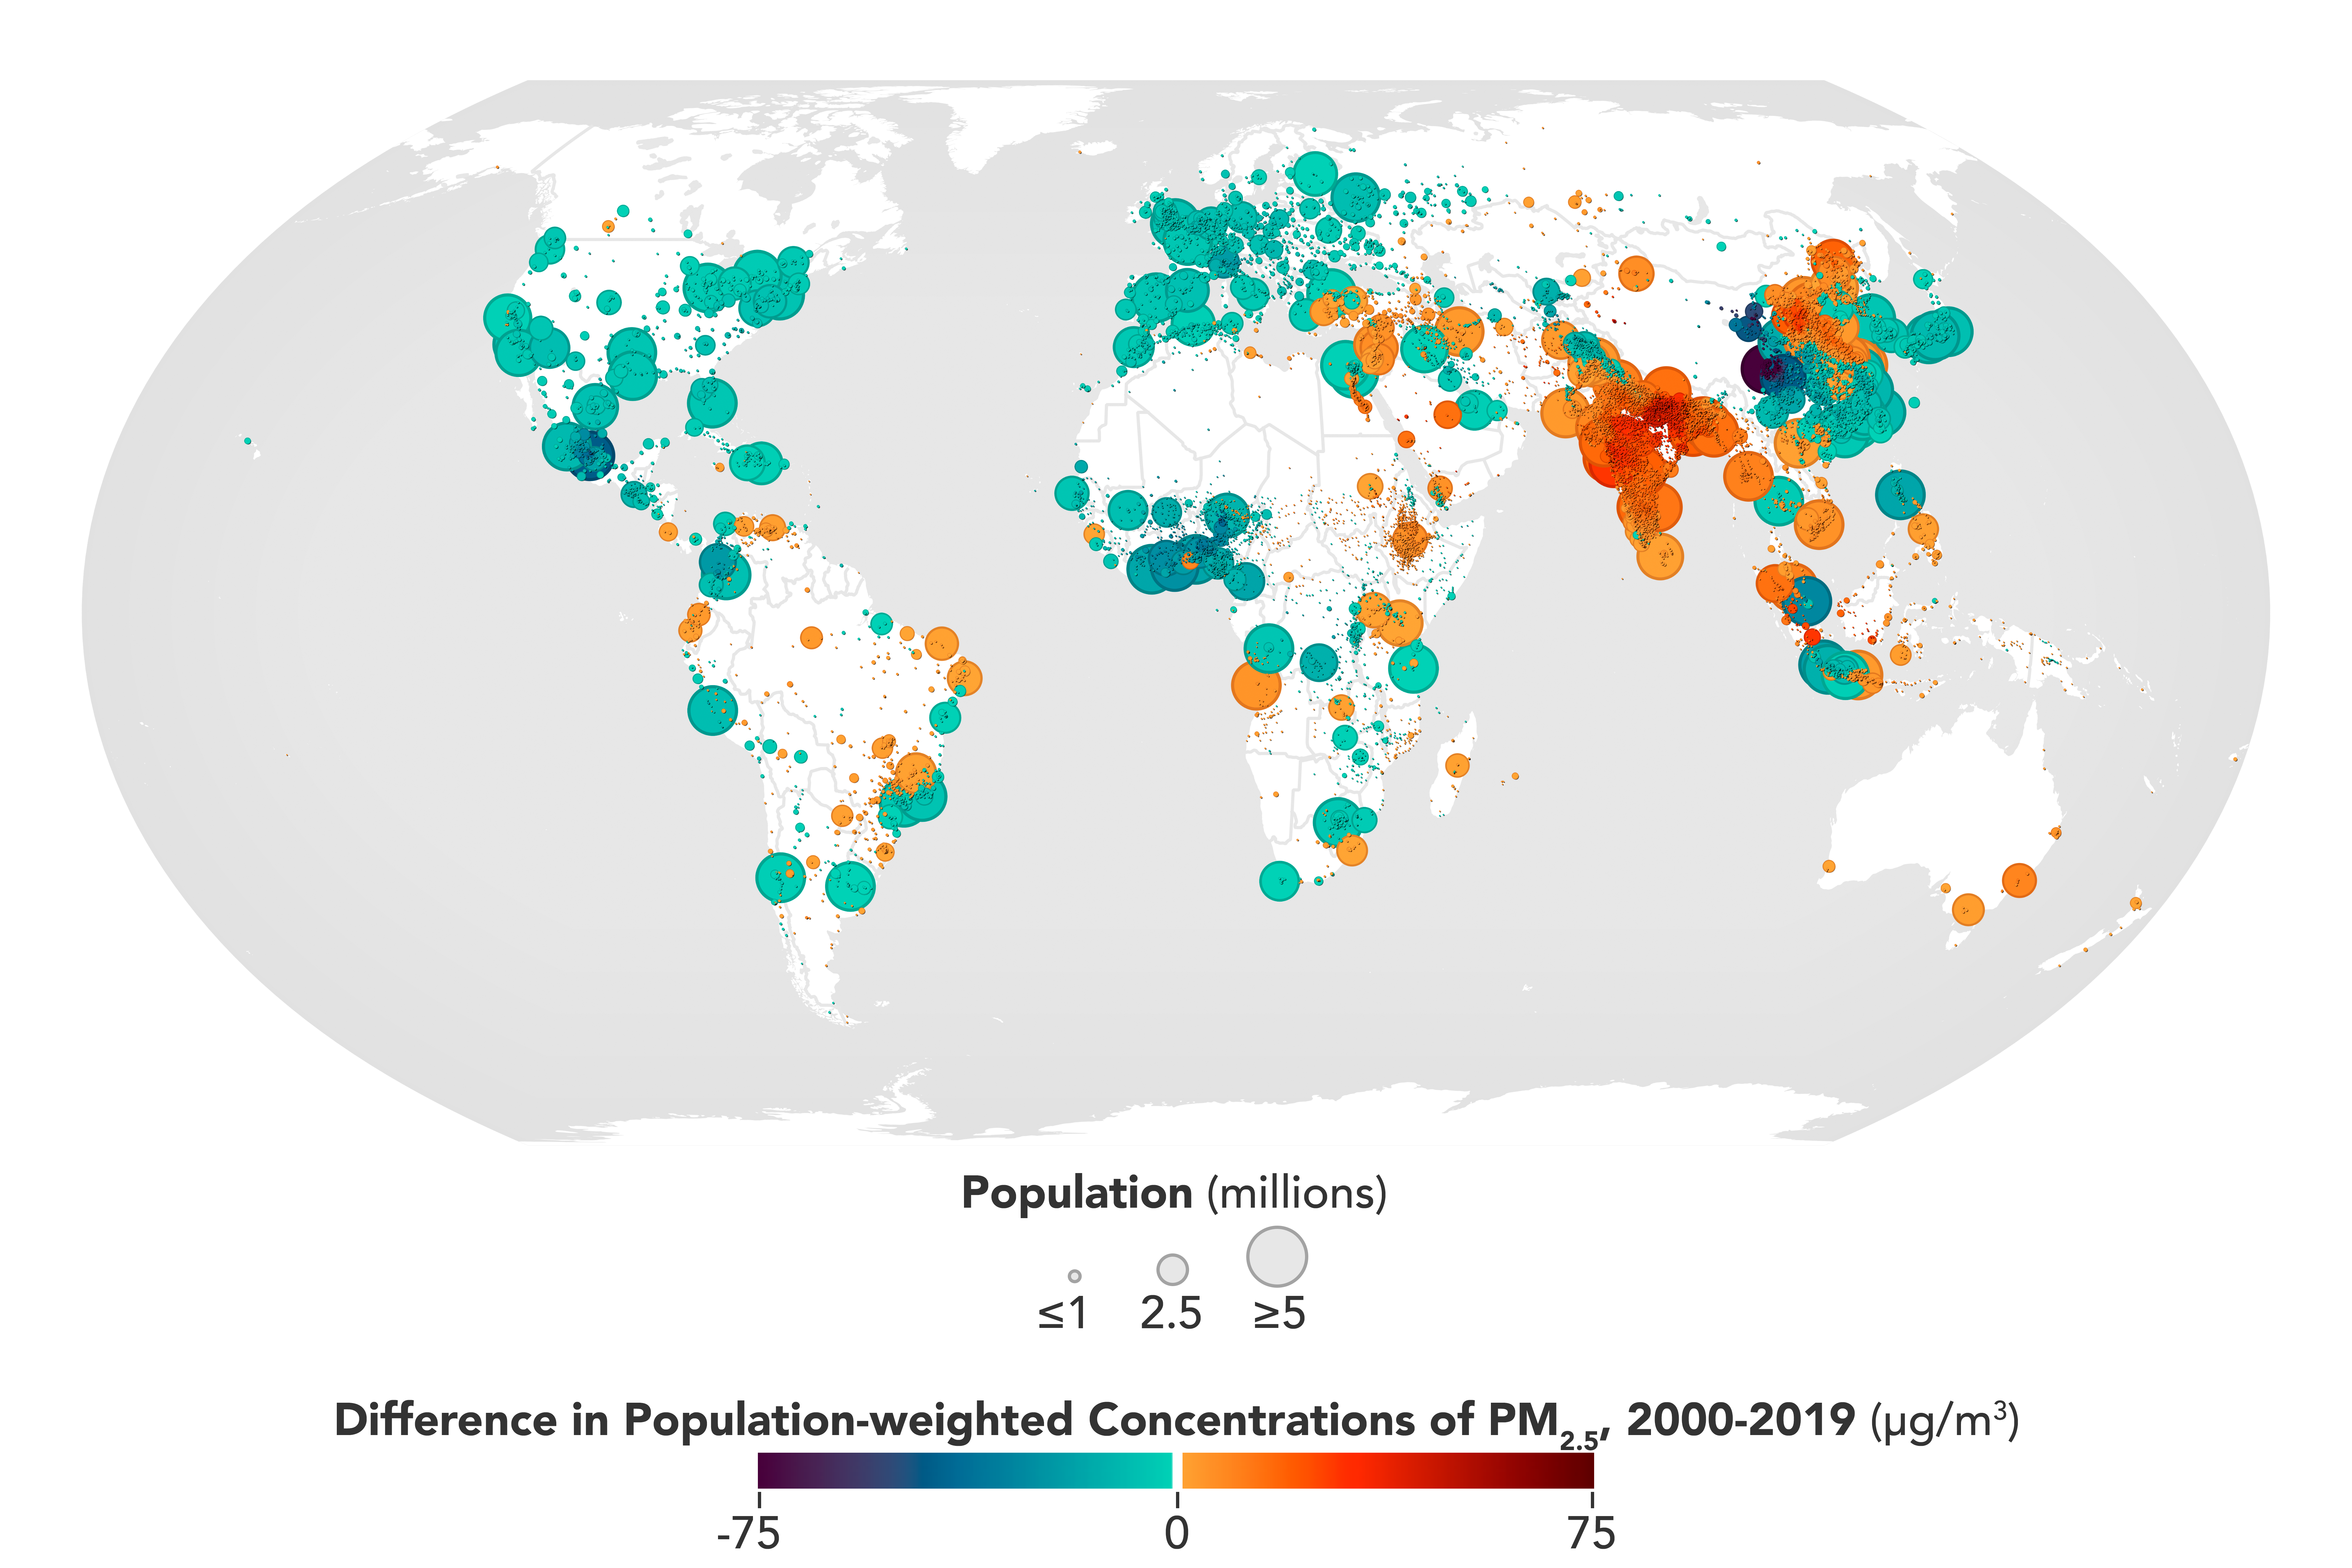
Students will engage in a “Zoom In Inquiry” learning routine to understand the symbols on a world map that shows population-weighted concentrations of PM2.5. They will reflect on how their perception of the image changed as they saw more of the image.

Grade Level: 9-12

Students will engage in a “Zoom In Inquiry” learning routine to understand a world map that shows changes in PM2.5-attributable mortality per 100,000 population (Bondie, 2013).

Grade Level: 6-8

Students visit a NASA Website called "Eyes on the Earth" to view satellite missions in 3D circling the Earth and learn to navigate to specific satellites to learn about their capability of analyzing our changing planet and air quality.

Google slides icon.
Grade Level: 6-8

Students watch videos and/or review articles related to particulate matter and how this pollutant is monitored and measured, then provide their understanding individually or in groups.

Google slides icon.
Grade Level: 6-8

Students watch videos and review articles related to ozone as a pollutant at ground level, and how ozone impacts environment, then provide their understanding in groups.

Grade Level: 6-8, 9-12

Students construct explanations about Earth’s energy budget by connecting a model with observations from side-by-side animations of the monthly mapped data showing incoming and outgoing shortwave radiation from Earth’s surface.

Grade Level: 9-12

The extreme temperatures during July 2022 prompt students to investigate a model that displays historical heat wave frequency data to discover the importance of defining terms when interpreting data.

Grade Level: 3-5, 6-8, 9-12

The Earth System Satellite Images, help the learner visualize how different Earth system variables change over time, establish cause and effect relationships for a specific variable, identify patterns, and determine relationships among variables over one year.

These NASA lessons support Next Generation Science Standards (NGSS) and three dimensional learning of the Earth System. These include activities where students interact with NASA maps, graphs, and datasets from the atmosphere, biosphere, cryosphere, geosphere, hydrosphere and the earth system.