List of all Cryosphere Interactives

all grade icon
elementary grade icon
middle grade icon
high grade icon
Grade Level: 6-8

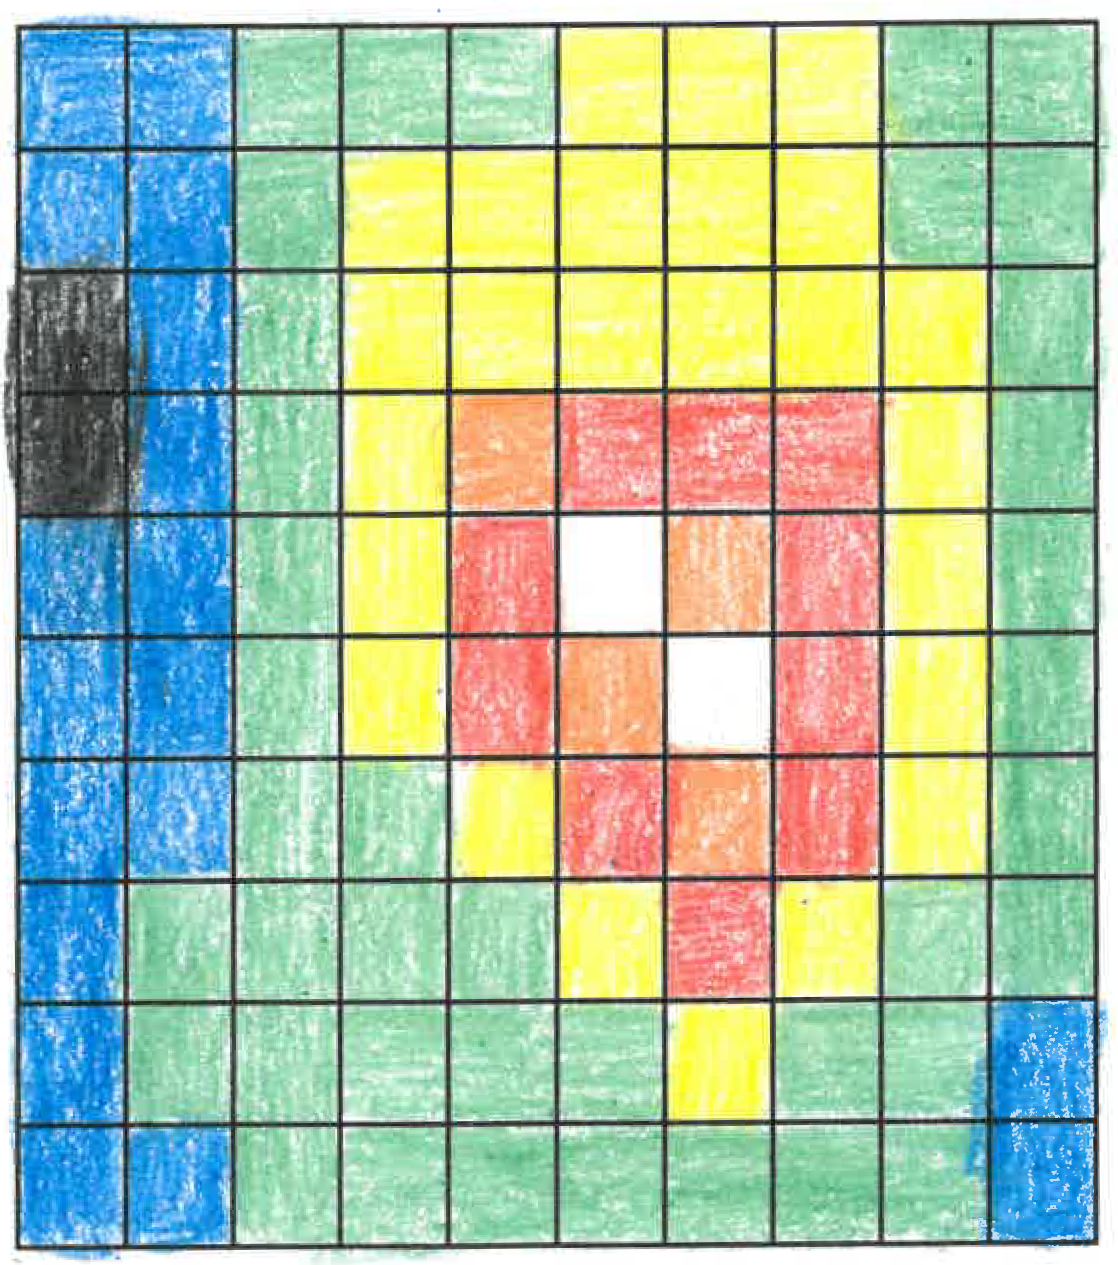
Scientific data are often represented by assigning ranges of numbers to specific colors. The colors are then used to make false color images which allow us to see patterns more easily. Students will make a false-color image using a set of numbers.

Grade Level: 9-12

Information from satellites if often used to display information about objects. This information can include how things appear, as well as their contents. Explore how pixel data sequences can be used to create an image and interpret it.

Grade Level: 6-8, 9-12

Using various visualizations (i.e., images, charts, and graphs), students will explore changes in sea ice extent as it relates to other spheres within the Earth System. This story map is intended to be used with students who have access to a computing device in a 1:1 or 1:2 setting.