Grade Level: 6-8,
9-12
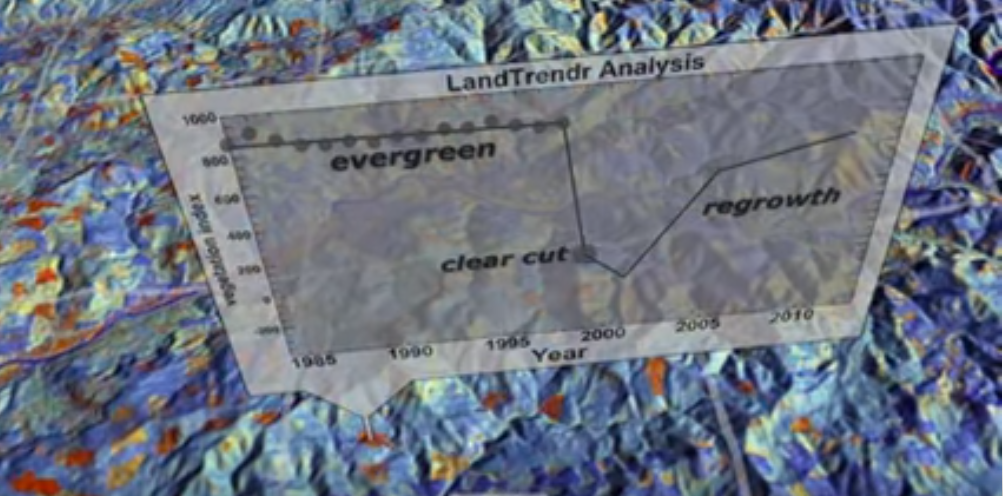
This mini lesson focuses on Landsat satellite data and how it is used to detect changes in land use.
The Earth is constantly changing. Some of this change occurs slowly over many millennia, and some occurs relatively rapidly over the decades. Major natural forces cause such changes as volcanoes, continental shifts, building and erosion of mountains, reorganization of oceans, appearance and disappearance of deserts and marshlands, advances and retreats of great ice sheets, rise and fall of sea and lake levels, and the evolution and extinction of vast numbers of species.


This mini lesson focuses on Landsat satellite data and how it is used to detect changes in land use.
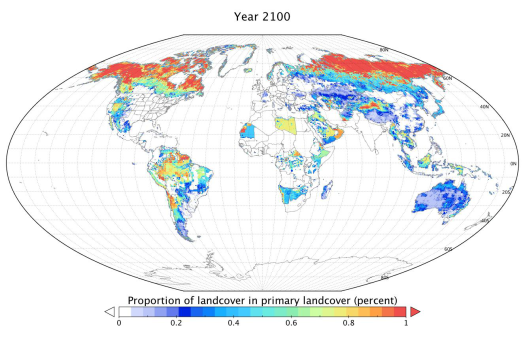
Examine the images to see the projected differences in land use between 1900 and 2100.
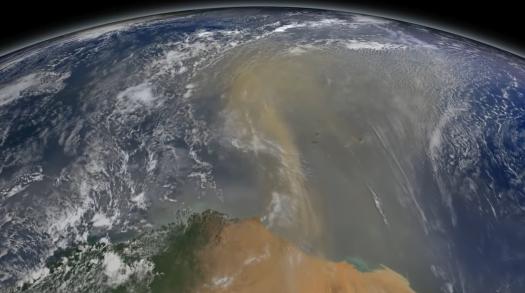
This mini lesson engages students in watching a NASA video related to accumulated dust that makes the trans-Atlantic journey from the Sahara Desert to the Amazon rainforest using NASA's CALIPSO satellite.

The fires in Greece during the summer of 2007 devastated large tracks of forest and ground cover in this Mediterranean region. Students analyze these data to determine the scale, area, and percentage of the forest impacted by of these fires.
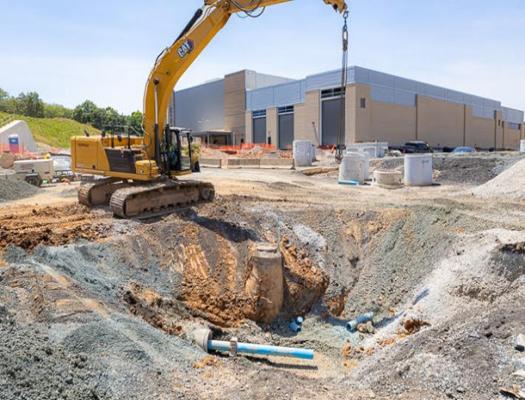
Students will engage in a collaborative learning routine as they explore slides that show how the development of public transportation infrastructure changed the land in Woodlawn, Maryland.
This mini lesson focuses on Landsat satellite data and how it is used to detect changes in land use.

Examine the images to see the projected differences in land use between 1900 and 2100.
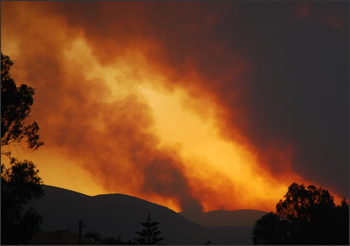
The fires in Greece during the summer of 2007 devastated large tracks of forest and ground cover in this Mediterranean region. Students analyze these data to determine the scale, area, and percentage of the forest impacted by of these fires.

Students will engage in a collaborative learning routine as they explore slides that show how the development of public transportation infrastructure changed the land in Woodlawn, Maryland.
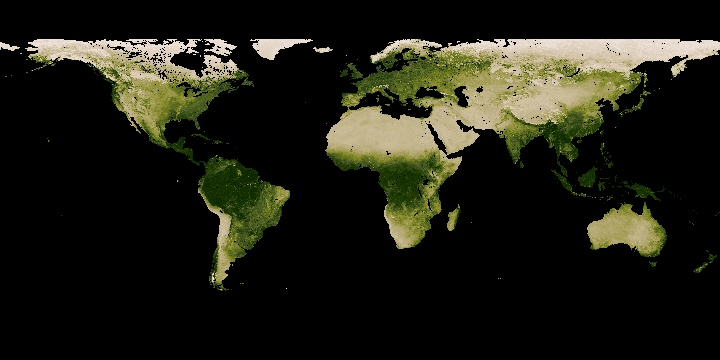
Students observe monthly images of changing vegetation patterns, looking for seasonal changes occurring throughout 2017. These data can be used by students to develop their own models of change.
