Mini Lesson/Activity
Identifying Changes in Land Use
Overview
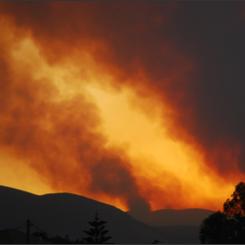
This mini lesson focuses on Landsat satellite data and how it is used to detect changes in land use. Students will answer questions based off of a NASA Video that features how Landsat data are interpreted in the forests of the Pacific Northwest, and gives examples of the effects insects and logging have with land management.
Student Directions
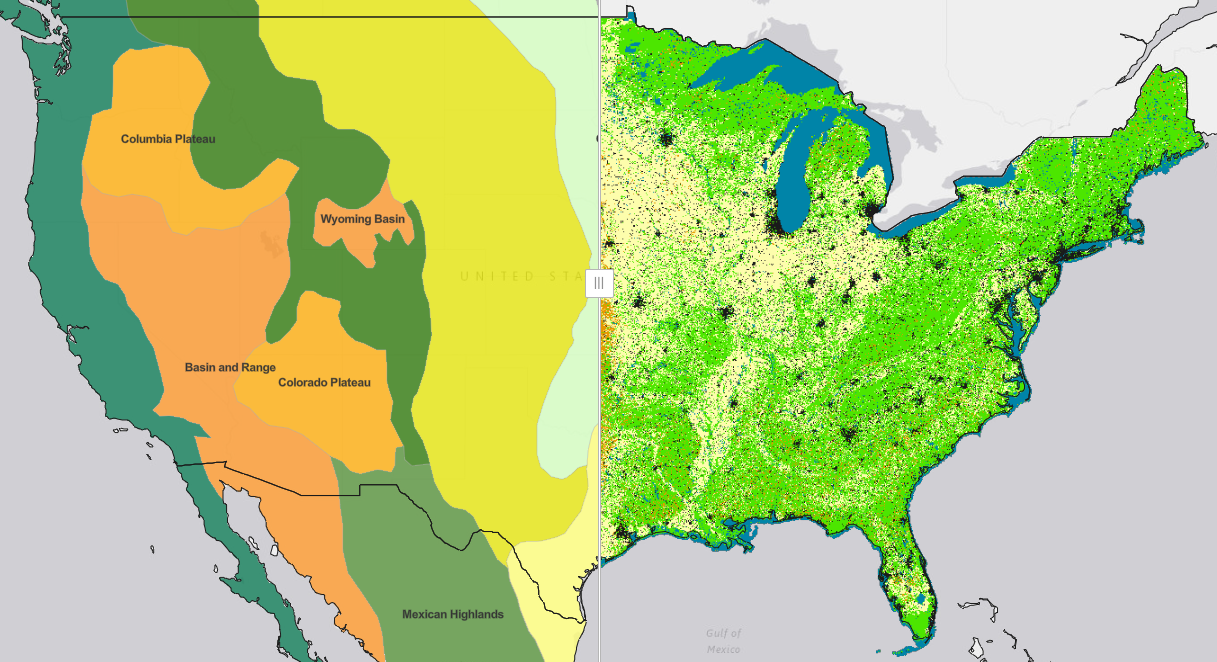
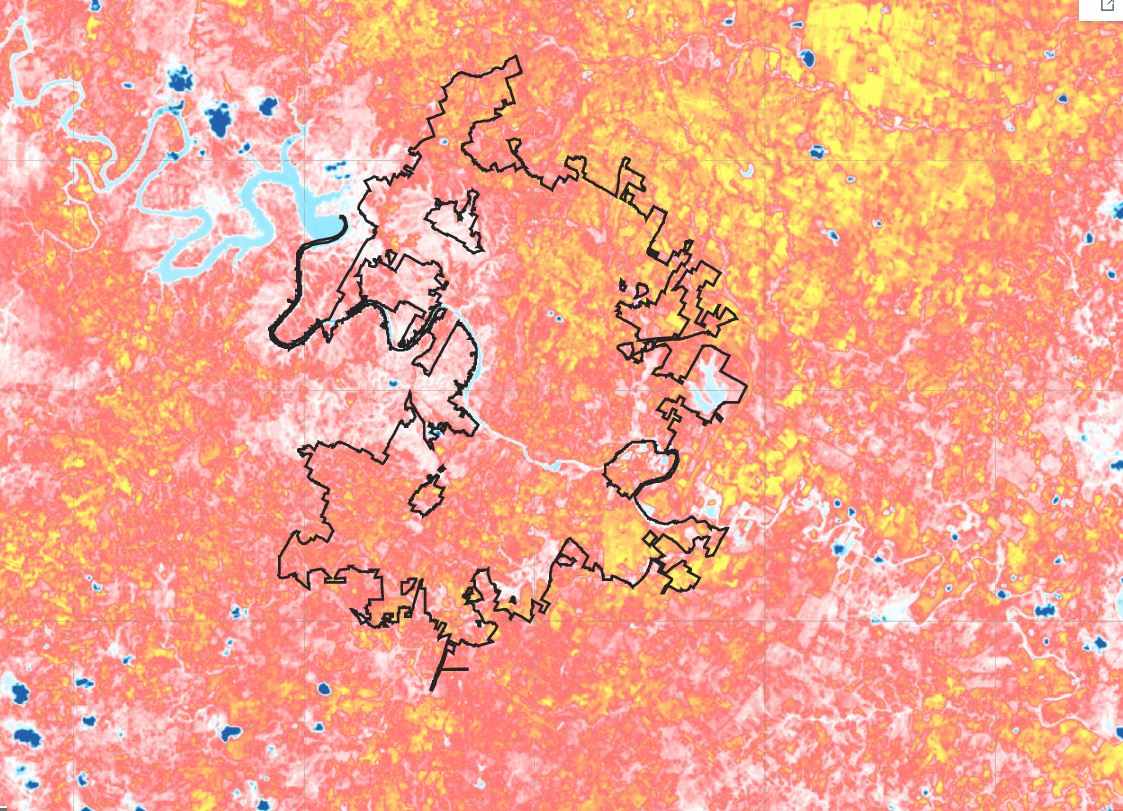
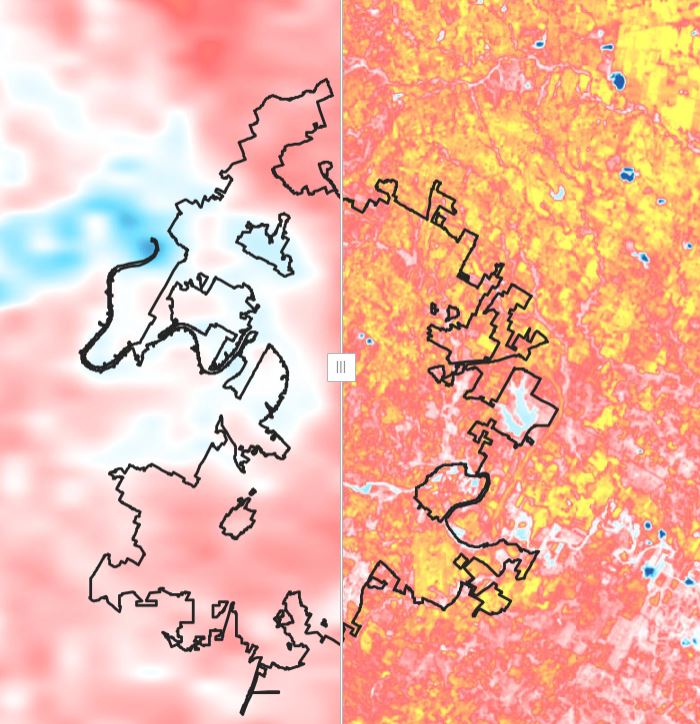
The following video, Secret Life of Forests shows a combination of visualizations made from Landsat data. These data are numbers which are shown on the visualizations as different colors in specific geographic locations. The result looks like a map with different colors. The different colors represent different types of land cover. Animating the visualizations over time can show how the land is changing over time.
Review the video and then answer the following questions.
Recommendation: Review the video one time to get a general idea of the content. Play close attention to the visualizations. Then, review the questions below for each of the three sections and repeat the video, looking to answer the questions about the three events that occurred. Stop the video at the following times for the events to better view the graphs.
- Clear Cut 0:59
- Bark Beetle 1:39
- Western Spruce Budworm 1:55
Steps:
- Check with your instructor on how to submit your answers.
- Clear Cut
- Identify the trend in the Pacific Northwest before the clear cut.
- When did the clear cut in the Pacific Northwest occur?
- Explain the impact of the forest after the clear cut.
- Bark Beetle
- Identify the trend in the forest before the Bark Beetle epidemic.
- When was the Bark Beetle epidemic?
- Explain the impact of the forest after the Bark Beetle epidemic.
- Western Spruce Budworm
- Identify the trend in the forest before the Western Spruce Budworm infestation.
- When was the Western Spruce Budworm infestation?
- Explain the impact of the forest after the Western Spruce Budworm infestation.
- How might these problems influence human activity?
- Explain the differences between what the visualization shows and what the graph shows.
Teacher Note
Teachers, these mini lessons/student activities are perfect "warm up" tasks that can be used as a hook, bell ringer, exit slip, etc. They take less than a class period to complete. Learn more on the "My NASA Data What are Mini Lessons?" page.
Teachers who are interested in receiving the answer key, please complete the Teacher Key Request and Verification Form. We verify that requestors are teachers prior to sending access to the answer keys as we’ve had many students try to pass as teachers to gain access.
Disciplinary Core Ideas:
- ESS3A: Natural Resources
- ESS3C: Human Impacts on Earth Systems
Crosscutting Concepts:
- Cause and Effect
Science and Engineering Practices:
- Developing and Using Models
- Analyzing and Interpreting Data