Interactive Models
Exploring the Tradeoffs of Surface Temperature Models
Overview
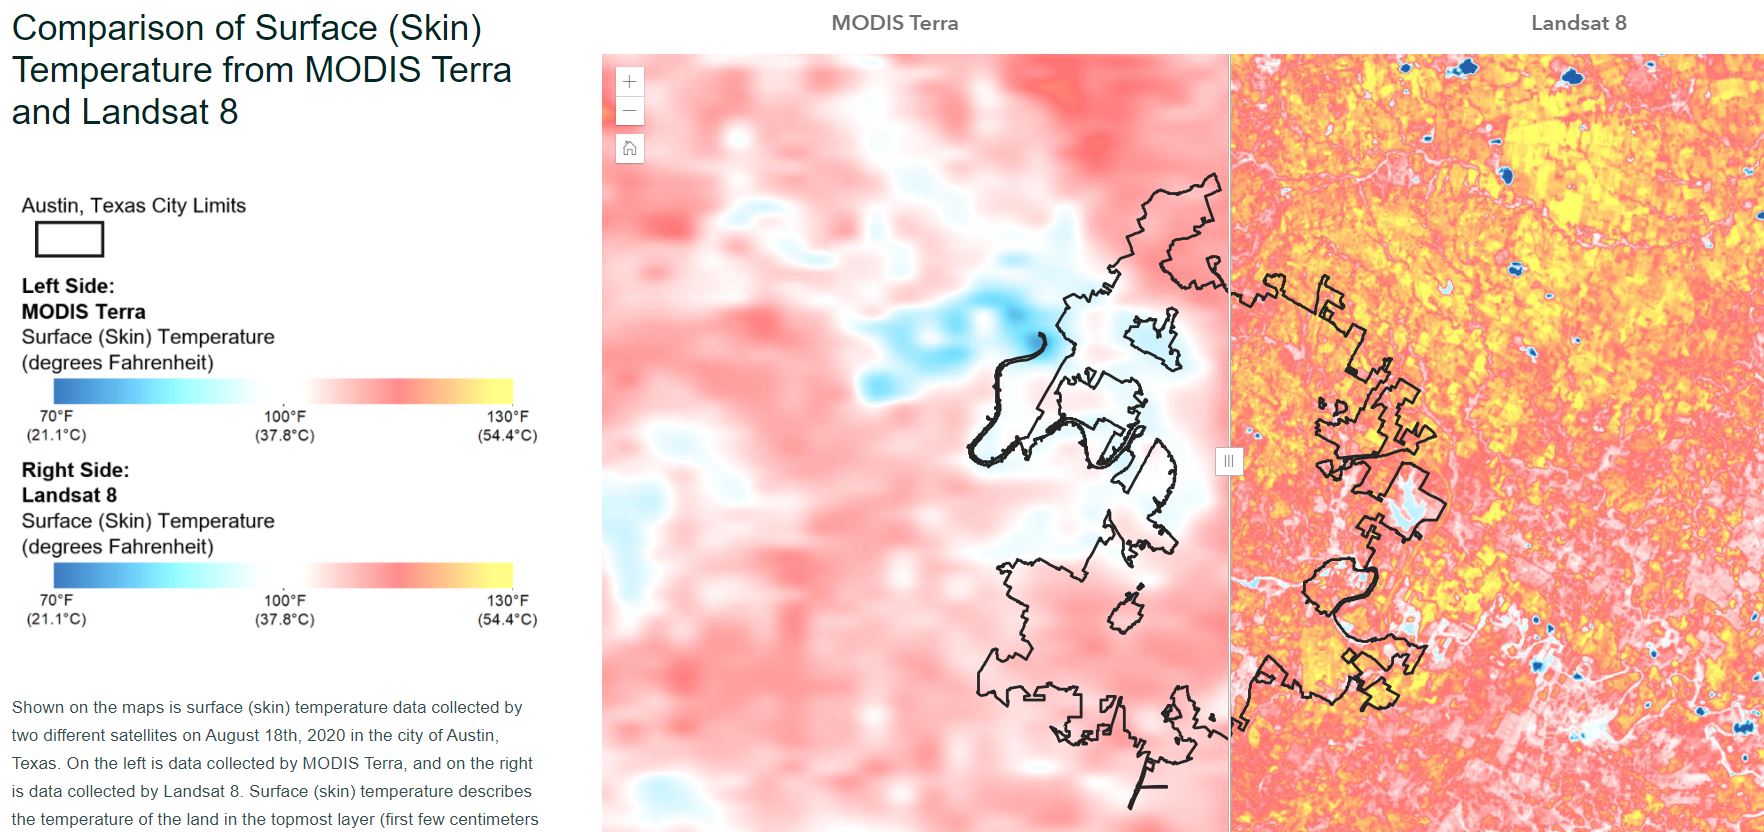
Using interactive maps that compare surface (skin) temperature data between MODIS and Landsat 8 satellites, students will learn about and describe the different characteristics of satellite data. Students will also describe the advantages and disadvantages of using two different satellites to study a phenomenon such as the Urban Heat Island Effect.
This interactive model is one of a three-part sequence of learning experiences related to the Creation of Urban Heat Islands. To maximize optimal learning outcomes, it is suggested to complete the series in the following order:
- Human Impact and the Creation of Urban Heat Islands Interactive Model
- Patterns in Earth's Surface Temperature Interactive Model
- Exploring the Tradeoffs of Surface Temperature Models (current page)
This story map is intended to be used with students who have access to a computing device in a 1:1 or 1:2 setting.
Materials Required
Resources Needed Per Student:
- Student Data Sheet or Student Data Form (Optional)
- Computer/Tablet
- Internet Access
- Link to Exploring Tradeoffs of Surface Temperature Models
Directions
- Using an internet accessible device, students open the link to Exploring the Tradeoffs of Surface Temperature Models to begin their exploration of this phenomenon.
- Distribute the Human Impact and the Exploring the Tradeoffs of Surface Temperature Models Student Sheet (optional). Have students navigate on their own through the interactive model to answer the questions and complete the activities on their student sheet.

Teacher Note
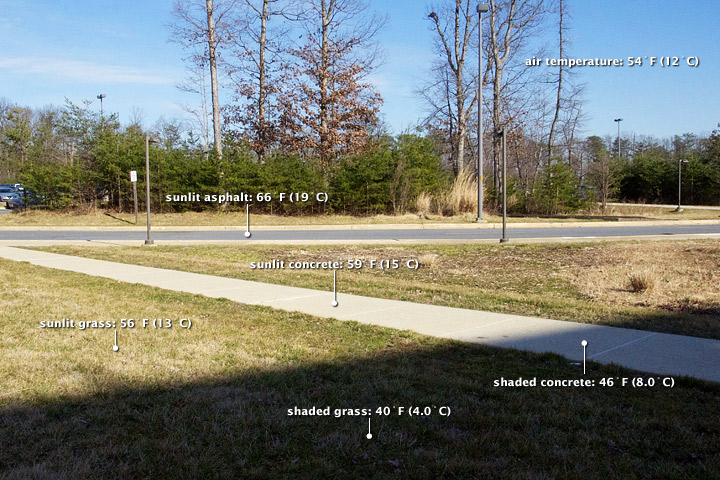
Heat islands form as vegetation is replaced by asphalt and concrete for roads, buildings, and other structures necessary to accommodate growing populations. These surfaces absorb—rather than reflect— the sun's heat, causing surface temperatures and near-surface air temperatures to rise near these surfaces. Displacing trees and vegetation minimizes the natural cooling effects of shading and evaporation of water from soil and leaves (evapotranspiration).
To learn more, visit:
- The Urban Heat Island Phenomena page for background information.
Virtual Teachers: Make a copy of the ![]() Google Form of your choice so that you may assign it directly from your Google Drive into your Learning Management System (e.g., Google Classroom, Canvas, Schoology, etc.). Do you need help incorporating these Google Forms into your Learning Management System? If so, read this
Google Form of your choice so that you may assign it directly from your Google Drive into your Learning Management System (e.g., Google Classroom, Canvas, Schoology, etc.). Do you need help incorporating these Google Forms into your Learning Management System? If so, read this ![]() Guide to Using Google Forms with My NASA Data.
Guide to Using Google Forms with My NASA Data.
Teachers who are interested in receiving the answer key, please complete the Teacher Key Request and Verification Form. We verify that requestors are teachers prior to sending access to the answer keys as we’ve had many students try to pass as teachers to gain access.
Disciplinary Core Ideas:
- ETS1B: Developing Possible Solutions
Crosscutting Concepts:
- Scale, Proportion, and Quantity
- Interdependence of Science, Engineering, and Technology
Science and Engineering Practices:
- Developing and Using Models
- Analyzing and Interpreting Data
- Constructing Explanations and Designing Solutions
- Students will list and describe the different characteristics of satellite data.
- Students will describe the advantages and disadvantages of using two different satellites to study the Urban Heat Island Effect.
- What are the advantages and disadvantages to using MODIS Terra or Landsat 8 to study the Urban Heat Island Effect?
- Why might a scientist use two different satellites to study the same phenomenon?
- How does pixel size influence the scale at which you can study a phenomenon?
- Internet Required
Complementary Interactives

Grade Band
- 6-8
- 9-12
Time
- 30 minutes
Visualization Tool
NGSS Three Dimensional Learning
- See drop-down menu at the bottom of the page