Mini Lesson/Activity
Analyzing Surface Temperature Differences
Overview
Students observe the surface temperatures of a variety of surface types found in a suburban environment.
Student Directions
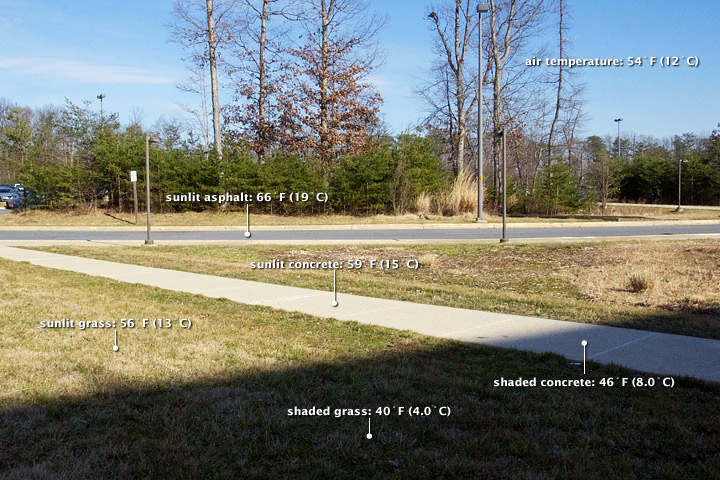
Credit: NASA Earth Observatory photographed by Robert Simmon
https://mynasadata.larc.nasa.gov/sites/default/files/inline-images/air_surface_temperature_text%20%281%29.jpg
Steps:
- Observe the image above and answer the following questions. Check with your instructor on how to submit answers.
- What time of year do you predict this to be? Explain your evidence.
- What is the temperature of the air?
- How do the temperatures of the grass measured in sunlight differ from grass in the shade?
- What is the temperature difference between sunlit concrete and shaded concrete? What does this difference in temperature tell you about how surfaces are heated?
- Based on what you have seen in this image, which type of area do you think is warmer, urban areas (cities and towns) or rural areas (countryside)? Why?
Source:
- Where Is the Hottest Place on Earth? (2012, April 5). NASA Earth Observatory. Retrieved May 11, 2022, from https://earthobservatory.nasa.gov/features/HottestSpot/page2.php
Teacher Note
Teachers, these mini lessons/student activities are perfect "warm up" tasks that can be used as a hook, bell ringer, exit slip, etc. They take less than a class period to complete. Learn more on the "My NASA Data What are Mini Lessons?" page.
Teachers who are interested in receiving the answer key, please complete the Teacher Key Request and Verification Form. We verify that requestors are teachers prior to sending access to the answer keys as we’ve had many students try to pass as teachers to gain access.
Disciplinary Core Ideas:
- ESS2A: Earth Materials and Systems
- ESS3A: Natural Resources
Crosscutting Concepts:
- Cause and Effect
Science and Engineering Practices:
- Analyzing and Interpreting Data

