Lesson Plans
What makes cities hot? An urban heat island activity
Overview
In this activity, students explore the Urban Heat Island Effect phenomenon by collecting temperatures of different materials with respect to their locations. This activity was modified from The NASA PUMAS Collection's "What makes cities hot? An urban heat island activity."
Materials Required
- Thermometers (consider infrared thermometers or paper* thermometers, glass thermometers )
- A variety of solid materials: aluminum foil, sand, black construction paper, white construction paper, soil, and two green sponges (one wet, one dry). NOTE: sod, moss, or potted wheatgrass or grass would be a great substitute if available.
- Optional: heat-sensitive paper or liquid crystal paper
- Pencil
- Clipboard
- Student Data Sheet
- Data Table
If there isn’t enough sun outside, then substitute a lamp with a heat bulb or any non-LED and non-fluorescent bulb. *A note on paper thermometers: paper liquid crystal thermometers take quantitative temperature measurements with a fairly large range of uncertainty, but are inexpensive, contain no breakable parts, and allow the measurement of surfaces as well as air. They contain strips of liquid crystals that are sensitive to different temperatures and change color to indicate that the current temperature is within a given range. A sensitivity of 2 degrees Celsius (3-4 degrees Fahrenheit) is sufficient for the exercise if done during sunny conditions or if using a lamp.
Setup
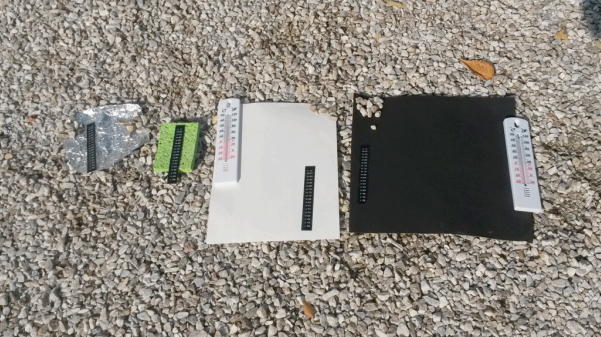
- Lay out the different materials in the light.
- Slightly moisten only one of the sponges.
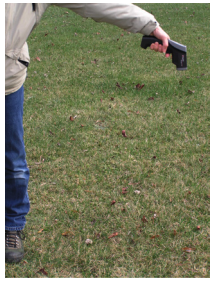
- A.) Place thermometers on top of each material. (Note: If using an infrared thermometer, you do not need to do to 3A.)
B.) Place thermometers above the material that is reading air temperature, making sure that the thermometer is not in direct contact with the material and is held above the material. NOTE: To make an air temperature reading according to the World Meteorological Organization, a thermometer must be situated 1.2 to 2 meters off the ground and shielded from direct sun. - Teacher's Note: Be sure to have the thermometer in the shade when you are measuring the air temperature because the sunlight shining directly on the thermometer will cause it to heat the liquid, giving you a higher than the true air temperature. Also, give the thermometer time to adjust to the outdoor temperatures (three to five minutes outside should be sufficient) before reading it. (Air temperatures must be measured out of direct sunlight because the materials in and around the thermometer can absorb radiation and affect the sensing of heat. You feel this with your own body: if you stand in direct sunlight, you feel warmer because your skin is being heated by both the air and by the radiant energy from the Sun.)
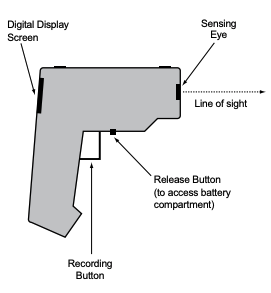
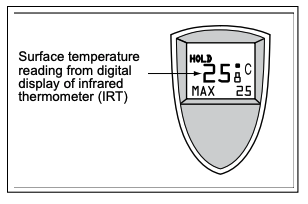
IR Thermometers:
|
|
|
This activity was modified from The NASA PUMAS Collection's "What makes cities hot? An urban heat island activity."
Source:
NASA PUMAS. “What Makes Cities Hot? An Urban Heat Island Activity.” NASA PUMAS, NASA, 2019, https://pumas.nasa.gov/examples/what-makes-cities-hot-urban-heat-island-activity. Accessed 08 29 2019.
Procedure
Set the Stage:
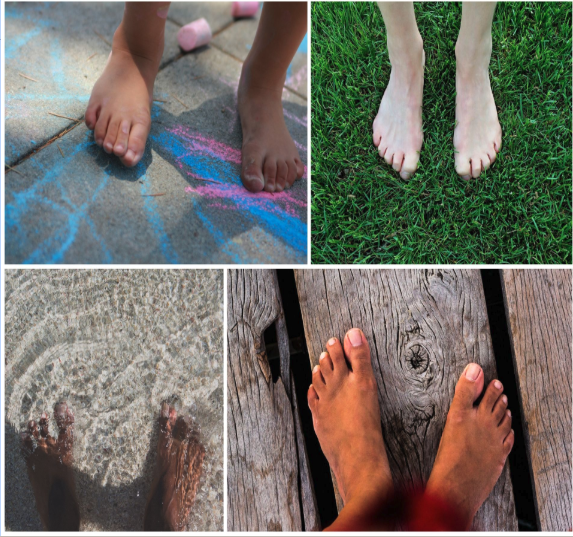
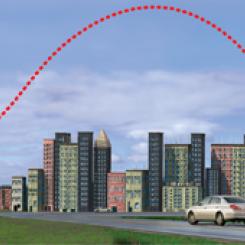
- Show students the picture above.
- Ask the student to think about which of these pictures they think would be the hottest on their feet. Coolest? Engage students in a discussion about this anchoring phenomenon.
Plan the Investigation:
- Tell the students that they will model the scientific practices of “Constructing explanations and engaging in argument from evidence.”
- Tell students that they will use thermometers to identify the hottest and coolest objects in their environment.
- Brainstorm with the students possible independent and dependent variables in the schoolyard environment that they could test related to the hotness or coolness of items in the yard.
- Possible variables could include:
-independent variable (manipulated) - the type of material, where the materials are located, how much sunlight reaches the materials, etc.;
-dependent variable (responding) - how fast or slow the material heats up or cools down, how bendable an object is, how faded the material becomes, etc. - Show the students the experiment setup with the air and surface thermometers, review how to read a thermometer. If thermometers have Fahrenheit and Celsius scales, direct them to read off both and translate between them.
- Once students are familiar with the thermometers, ask them to predict which items would likely be the hottest and coolest.
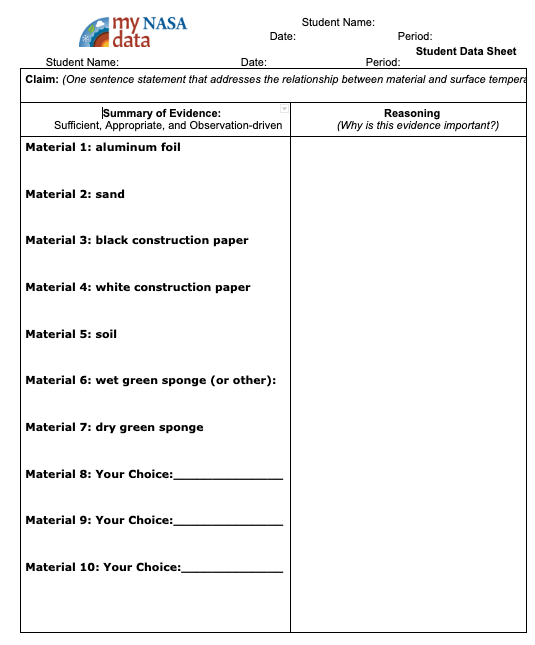
- Distribute the Student Data Sheet and Data Table and direct students to make a claim about the material that will likely be the hottest at the top of the Student Sheet.
- Next, review the Data Table. Model for students how to record the air and surface temperatures from one of the materials using the data table. Demonstrate the difference between the temperature taken in the air, and the temperature taken of a hot object. Note that the air temperature value should be taken in the shade. Show students to how to create a shadow on the thermometer.
- Draw attention to the last three materials of their choice. Students explore beyond the demonstration materials and ask them to find the hottest and coolest materials around the site, recording their temperatures and locations.
Collect the Data:
- Distribute the thermometers, pencil, and clipboards to the students.
- Direct students to record the surface and air temperatures of the materials on their datasheet using the "set up" that the teacher has created outside, as well as the "Your Choice" materials, paying attention to the hottest and coolest air temperatures.
- Collect data and then return to class.
Analyze the Data:
- On the board or together in a spreadsheet that you display on the board, have students report their data. Write/type each value.
- What similarities or differences do you see? What are the possible causes of these differences?
- Have students summarize their data by addressing the following questions:
-What are the differences between the ground and the air? What inferences can you make about these differences?
-What differences do you observe between temperatures of materials? What do you think causes this?
-What differences do you observe between site locations? What do you think causes these differences? - Now have students returning to their Claim. Does the evidence support their claim? Why or why not?
Substitutions for younger/less advanced students:
Ask students to touch the various materials and ask which are hotter. Explain how to use a thermometer, and then ask them to measure which material is hottest. Discuss. These general concepts can be illustrated without the use of formal measurements as well: wetting heat-sensitive paper or liquid crystal paper results in a dramatic color change. Demonstrate and explain how the paper thermometer’s color changes when exposed to different temperatures. Take the wet sponge and the dry sponge, and ask which one the students think is hotter and which is cooler. To test this, wipe the sponges on the heat-sensitive or liquid crystal paper thermometers (or use a spray bottle to wet one of the thermometers). For the dry sponge, no temperature change will occur, because the sponge will be at the temperature of the surroundings. For the wet sponge, the paper color should change instantly. Explain how when we sweat, we cool off by evaporation, and similarly, the paper thermometer is cooling off by evaporation.
Substitutions for older/more advanced students:
While students are measuring temperature, draw a map that roughly illustrates the ground (demarcating grass and asphalt or other land cover classes) and a table to record their results. Compute statistics as appropriate for the students’ level (mean, range, max, min, etc.) and make a map marking land temperatures in one color and air temperatures in another color. This could also lead to a lesson about measurement uncertainty.
Communicate our Findings: What are we seeing and why?
- Next, lead a discussion/presentation that presents the scientific understandings behind their observations using the presentation points below:
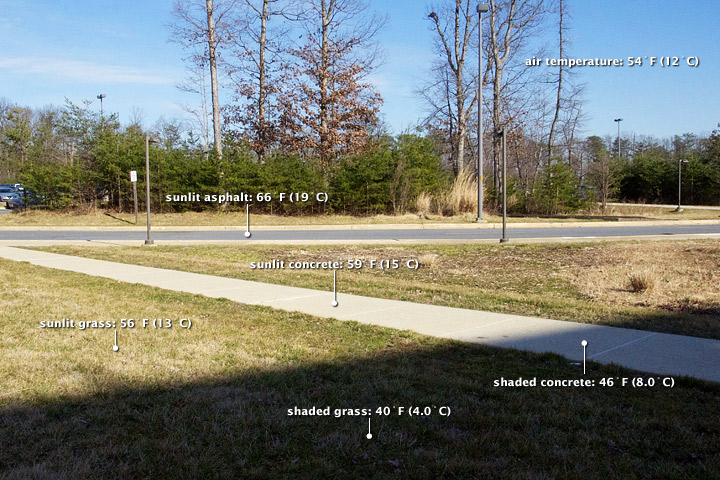
Students should notice that sunny areas are hotter than shaded ones, concrete and brick tend to be hotter than grassy areas, and that unobstructed walls facing the sun are hotter. (Often–but not always – in the Northern Hemisphere, the warmer walls are likely to be south-facing.) Note: This activity works particularly well if the site includes a concrete sidewalk as well as vegetation and walls or any variety of land covers and materials, so students can focus on measuring the different objects available. If not, then focus may be directed toward how much sunlight each area receives: walls that receive more sunlight are generally warmer, and walls that receive less sunlight are generally cooler. However, some materials warm or cool faster than others.
2. Review the following questions and content with your students:
A) What are the differences between the ground and the air? What inferences can you make about these differences?
Differences between the ground and the air: The black piece of paper is warmer than the air above it. This is because the paper is an opaque solid that absorbs sunlight, and the air is a gas that is transparent to sunlight. Gases have molecules that are farther apart than those of solids, meaning that gases generally hold less heat than solids and liquids and it takes more energy to heat them up. Not all gases are transparent to sunlight (for example, air containing the pollutant gas NO2 is brownish), not all solids are opaque (consider clear plastic or glass), and some solids reflect rather than absorb sunlight (white paper and clean snow, for example). The gases in our atmosphere are mostly transparent to the visible light we see, so when light passes through our air it doesn’t interact with the molecules very much, leaving its energy to be passed to the Earth’s surface.
B) What differences do you observe between temperatures of materials? What do you think causes this?
Differences between temperatures of materials: The different materials have different reflective and absorption properties, and some are more transparent than others. This is why the paper’s color makes a difference: white paper reflects sunlight better than black paper. Energy is conserved, so the more energy a material reflects or transmits, the less it is able to absorb and re-emit as heat energy. Materials also absorb heat differently due to their conductivity, which is why denser materials such as metals become hotter than paper under similar external conditions (metal has a higher conductivity than paper). Another factor that affects the way materials change temperature is evaporation. Water can also play a role in this: when water heats up, it evaporates. Evaporation requires a lot of energy, and when the water goes from liquid to gas form it absorbs energy. Evaporation is one of the reasons why the ocean is cooler than land during the summer.
C) What differences do you observe between site locations? What do you think causes these differences?
Differences between site locations: Different site locations receive different amounts of sunlight. In particular, sunlit walls receive more energy, and all else being equal tend to be warmer.
6. Provide students with time to summarize this new information in the Reasoning section of their student sheet for each material. Model this process using the information provided in this section.
Extend Our Learning:
- Present this question to the class.
How does this affect our city? How are our activities, such as where we eat, sleep, play, and gather be impacted?
- Have students work in pairs to discuss and report out. Student's ideas about how this phenomenon would affect their daily lives will vary.
- Follow up with a whole class discussion using the talking points below.
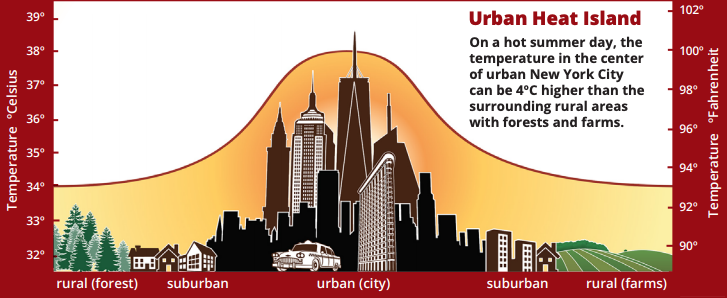
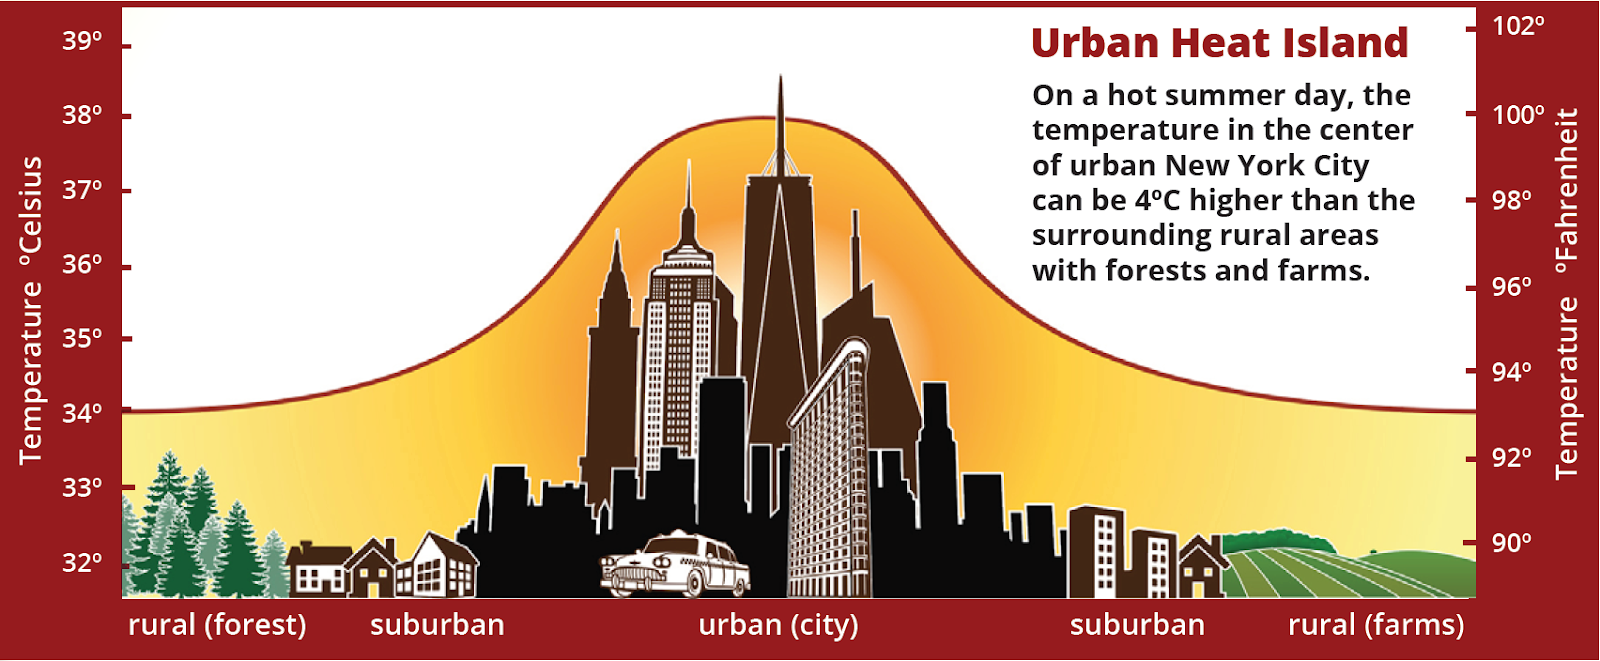
An urban heat island occurs when a city experiences much warmer temperatures than nearby rural areas. An urban area is a city. A rural area is out in the country. The sun’s heat and light reach the city and the country in the same way. The difference in temperature between urban and less-developed rural areas has to do with how well the surfaces in each environment absorb and hold heat.
If you travel to a rural area, you’ll probably find that most of the region is covered with plants. Grass, trees and farmland covered with crops, as far as the eye can see. When you visit a big city, you won’t see many plants. Instead, you’ll see sidewalks, streets, parking lots and tall buildings. These structures are usually made up of materials such as cement, asphalt, brick, glass, steel and dark roofs.
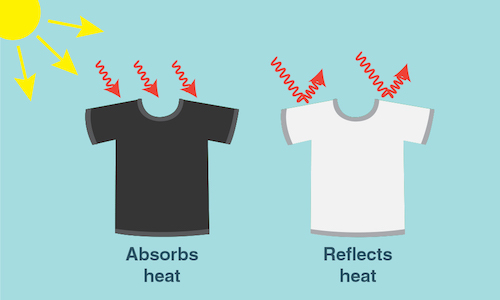
Materials such as asphalt, steel, and brick are often very dark colors—like black, brown and grey. A dark object absorbs all wavelengths of light energy and converts them into heat, so the object gets warm. In contrast, a white object reflects all wavelengths of light. The light is not converted into heat and the temperature of the white object does not increase noticeably. Thus, dark objects—such as building materials—absorb heat from the sun.
Urban building materials are another reason that urban areas trap heat. Many modern building materials are impervious surfaces. This means that water can’t flow through surfaces like a brick or a patch of cement like it would through a plant. Without a cycle of flowing and evaporating water, these surfaces have nothing to cool them down.
Disciplinary Core Ideas:
- ESS2A: Earth Materials and Systems
Crosscutting Concepts:
- Cause and Effect
Science and Engineering Practices:
- Planning and Carrying out Investigations
- Analyzing and Interpreting Data
- Constructing Explanations and Designing Solutions
- Engaging in Argument from Evidence
- Students collect air temperature and surface temperatures of different materials located in the same environment
- Students collect air temperature and surface temperatures of different materials located in different environments whereby the input of light may be different
- Why do different materials experience differences in surface temperature?
What Area Urban Heat Islands?
An urban heat island occurs when a city experiences much warmer temperatures than nearby rural areas. An urban area is a city. A rural area is out in the country. The sun’s heat and light reach the city and the country in the same way. The difference in temperature between urban and less-developed rural areas has to do with how well the surfaces in each environment absorb and hold heat.
When Do Urban Heat Islands Occur?
If you travel to a rural area, you’ll probably find that most of the region is covered with plants. Grass, trees and farmland covered with crops, as far as the eye can see.
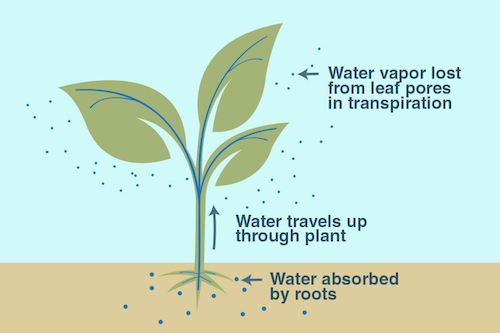
Plants take up water from the ground through their roots. Then, they store the water in their stems and leaves. The water eventually travels to small holes on the underside of leaves. There, the liquid water turns into water vapor and is released into the air. This process is called transpiration. It acts as nature’s air conditioner.
You can feel cooling transpiration at work on a hot summer day. On a sunny day, go outside and find a sidewalk that is right next to a patch of grass. Feel both surfaces. The grass should feel cooler on your skin than the pavement—and that’s mostly due to transpiration!
When you visit a big city, you won’t see many plants. Instead, you’ll see sidewalks, streets, parking lots and tall buildings. These structures are usually made up of materials such as cement, asphalt, brick, glass, steel and dark roofs.
Materials such as asphalt, steel, and brick are often very dark colors—like black, brown and grey. A dark object absorbs all wavelengths of light energy and converts them into heat, so the object gets warm. In contrast, a white object reflects all wavelengths of light. The light is not converted into heat and the temperature of the white object does not increase noticeably. Thus, dark objects—such as building materials—absorb heat from the sun.
Urban building materials are another reason that urban areas trap heat. Many modern building materials are impervious surfaces. This means that water can’t flow through surfaces like a brick or a patch of cement like it would through a plant. Without a cycle of flowing and evaporating water, these surfaces have nothing to cool them down.
Where Do Urban Heat Islands Occur?
The hottest places on Earth — in the city or the countryside — have a few traits in common. They are full of rock and stone. They do not have a lot of water, plants, or trees. And they are full of dark colors. The location of the hottest place on Earth can change, but these conditions do not.
Cities are full of these rocky surfaces — asphalt, brick, and concrete — that absorb heat by day and release it at night. These materials are used to make the sidewalks, parking lots, roads, and basketball courts of urban areas. Their hard and dark-colored surfaces contribute to the urban heat island effect, which means cities and other highly developed areas are hotter than the plant-covered countryside. Cities also have a lot of glass that reflects and concentrates light. Tall buildings can slow the cooling winds, and fewer plants and trees also mean less shade and less water vapor in the air.
Urban areas often see temperatures rise 6°C (10°F) hotter than the surrounding suburbs and rural areas. Cities tend to be hotter than their surrounding areas at all times of day and at all times of the year. However, a variety of factors influence the urban heat island. Bigger cities tend to have stronger heat-trapping capacities than smaller cities. Cities surrounded by forest have more pronounced heat islands than do cities in arid environments
Cities don’t just feel warmer during the daytime; they are also warmer at night. This is because stone buildings and paved streets store heat during the day and release it long after the Sun has set. That heating effect even means there is less snow in the city during the winter.
Why Does NASA Study Urban Heat Islands?
Urban heat islands are one of the easiest ways to see how human impact can change our planet. After all, sidewalks, parking lots and skyscrapers wouldn’t exist if humans weren’t there to build them. And although these structures are essential to city living, the heat islands they create can be dangerous for humans.
In the summer, New York City is about 7°F (4°C) hotter than its surrounding areas. That doesn’t seem like much, but these higher temperatures can cause people to become dehydrated or suffer from heat exhaustion. The hot temperatures also mean that more energy is required to operate fans and air conditioners to cool buildings. This can lead to power outages and a serious danger to public health.
But, there are things we can do to help cool the cities down. And NASA satellites can help to figure out where these cities are the hottest.
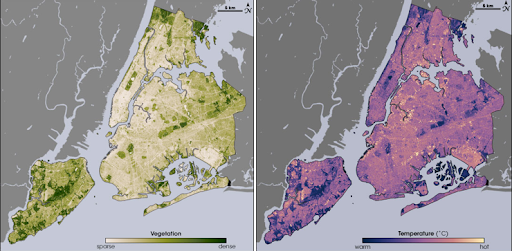
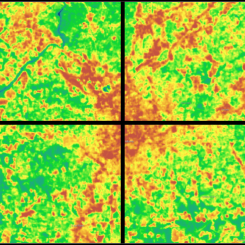
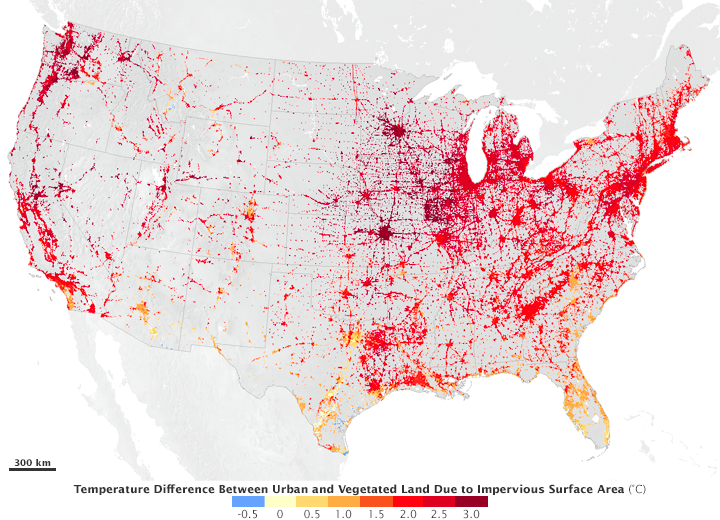
Caption: These images from the NASA/USGS satellite Landsat show the cooling effects of plants on New York City’s heat. On the left, areas of the map that are dark green have dense vegetation. Notice how these regions match up with the dark purple regions—those with the coolest temperatures—on the right. Image credit: Maps by Robert Simmon, using data from the Landsat Program.
Earth-observing satellites, such as Landsat and Suomi-NPP, can keep a close eye on the Earth’s vegetation and surface temperature. Scientists can use this information to track hotspots in cities across the planet. NASA scientists, with their global satellite views, are working to understand urban heat islands and help urban planners to build more energy efficient, cooler and safer cities.
What Can Be Done to Prevent Urban Heat Islands?
Urban Heat Islands affect 3.5 billion people who live in cities. Around the world, scientists, engineers, and builders are looking for new ways to build houses and offices that reflect more sunlight into space. And city planners are setting aside more space where grasses, trees, and streams can cool the air naturally.
Some cities are ‘lightening’ streets. This is done by covering black asphalt streets, parking lots, and dark roofs with a more reflective gray coating. These changes can drop urban air temperatures dramatically, especially during the heat of summer.
Planting gardens on urban rooftops can also help to cool down the city! In fact, a study in Los Angeles, California, calculated that changes like these would be enough to save close to $100 million per year in energy costs!
To help cool the heat island, builders can use materials that will allow water to flow through. These building materials—called permeable materials—promote the capture and flow of water, which cools urban regions.
How to read a thermometer
The following list is taken from Operation Physics Elementary / Middle School physics education outreach project of the American Institute of Physics.
The web page Children’s Misconceptions about Science provides a list of misconceptions in several areas of physical science, including heat and temperature. Here are a few that you might hear in your own classroom:
STUDENTS MAY THINK… INSTEAD OF THINKING… Heat is a substance. Heat is not energy. Heat is energy. Temperature is a property of a particular material or object. (For example, students may believe that metal is naturally cooler than plastic.) Temperature is not a property of materials or objects. Objects exposed to the same ambient conditions will have the same temperature. The temperature of an object depends on its size. Temperature does not depend on size. Heat and cold are different. Cold is the absence of heat. Heat and cold can be thought of as opposite ends of a continuum. Cold is transferred from one object to another. Heat is transferred from one object to another. Heat moves from the warmer object to the cooler object. Objects that keep things warm (sweaters, mittens, blankets) are sources of heat. Objects keep things warm by trapping heat. Some substances (flour, sugar, air) cannot heat up. All substances heat up, although some gain heat more easily than others. Objects that readily become warm (conductors of heat) do not readily become cold. Conductors gain (and lose) heat easily.
National Geography Standards:
- How to use maps and other geographic representations, tools, and technologies to acquire, process, and report information from a spatial perspective.
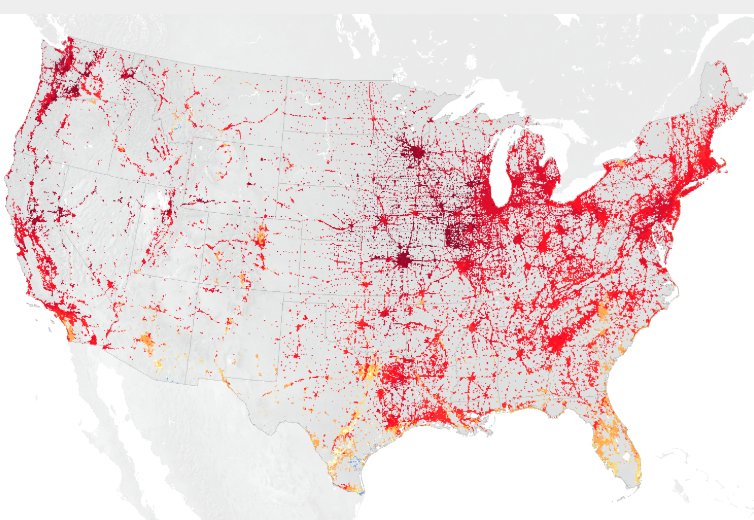
An urban heat island occurs when a city experiences much warmer temperatures than in nearby rural areas. Cities are full of rocky surfaces – asphalt, brick, and concrete – which increases the amount of energy from solar radiation they absorb. Urban areas often see temperatures rise 6°C (10°F) hotter than the surrounding suburbs and rural areas. These higher temperatures can cause people to become dehydrated or suffer from heat exhaustion. NASA analyzes surface temperature data from around the world to better understand the characteristics of cities that drive the development of urban heat islands.
Atmospheric and Space Scientists – Investigate weather and climate-related phenomena to prepare weather and climate-related phenomena to prepare weather reports and forecasts for the public
Computer and Information Scientists – Conduct research in the field of computer and information science
Applications Software Developers – Develop and modify computer applications software that is used to communicate with satellites and people using satellite data
- Computer Programmers
- Systems Engineers
- Software Engineers
- Advanced technical equipment/expertise required