Ocean waters are constantly on the move; understanding how and why they move is not an easy task. However, it is an important job considering that these waters affect Earth’s climate, as well as habitats for plants and animals, even on land.
>> Read More >>
Just one moment,
loading Hydrosphere...
Featured Mini Lessons
-
-
-
-
-
Grade Level: 6-8
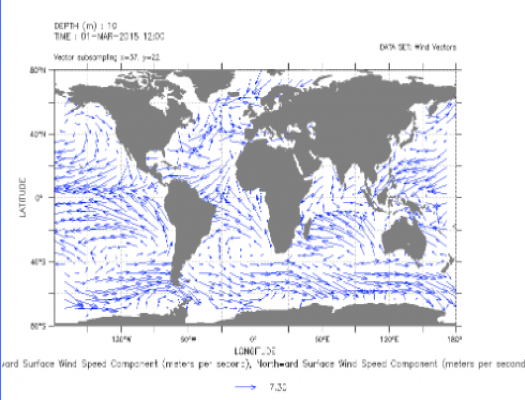
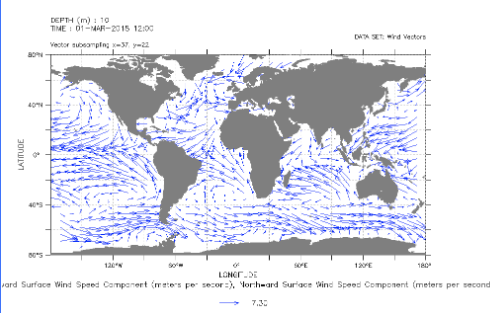
Students review an animation of monthly average wind speed at 10 meters above the ocean surface for our global ocean to analyze the relationship between winds and ocean surface currents.
Grade Level: 6-8
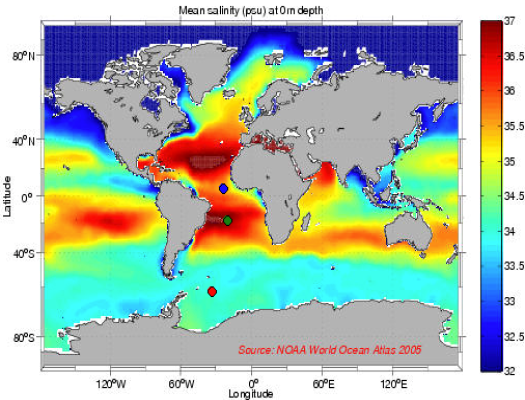
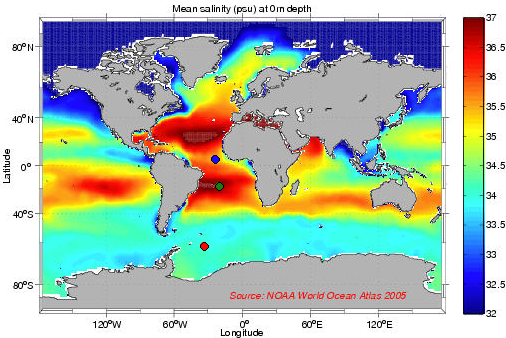
In this mini lesson, students use in-water profiles of historical ocean data to analyze how sea surface salinity varies with depth.
Grade Level: 6-8
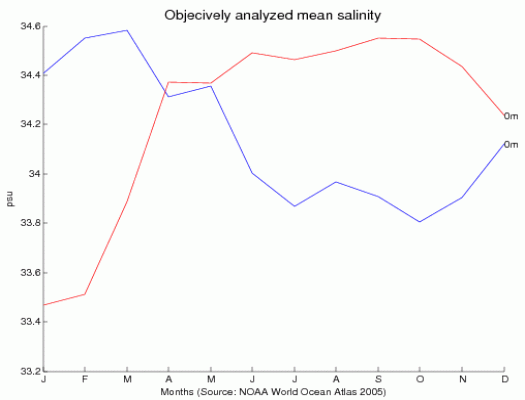
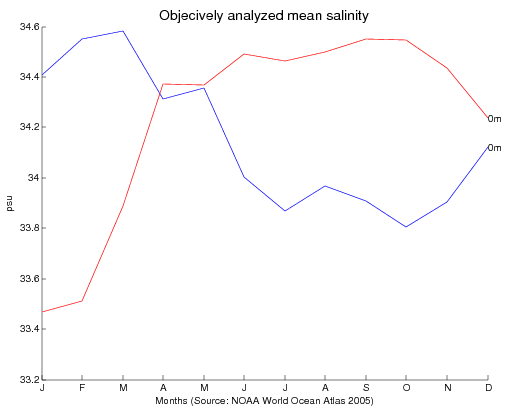
This mini-lesson features time-series graphs of mean salinity at the surface for the Arctic and Antarctic regions. A series of questions guides students in their analysis.
Grade Level: 6-8
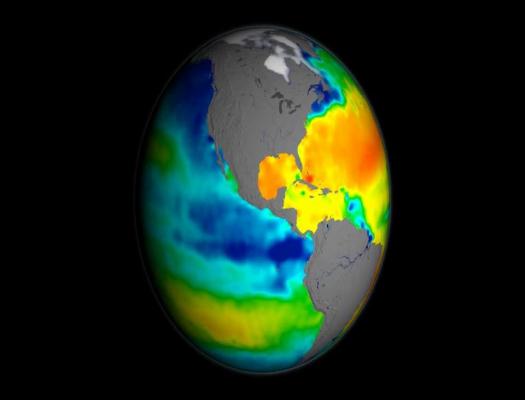
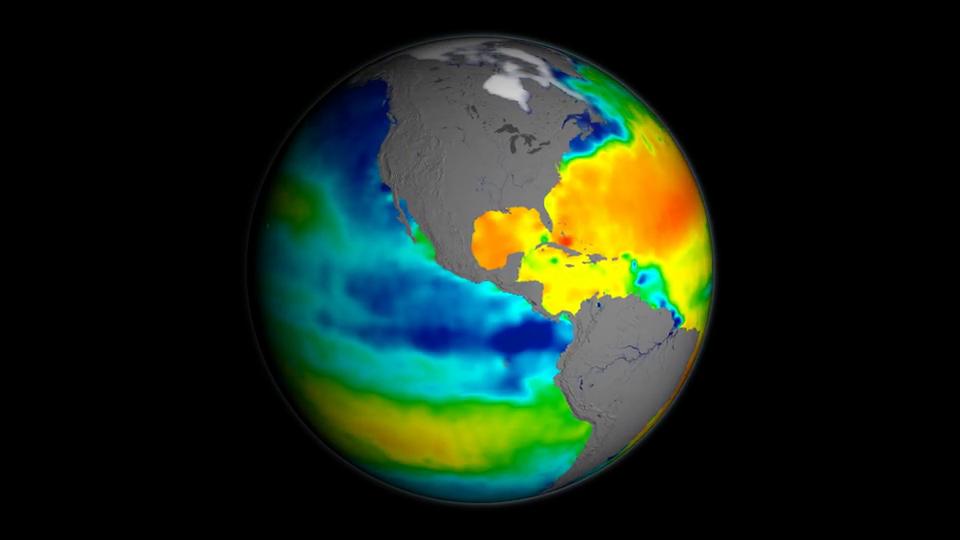
This NASA visualization shows sea surface salinity observations (September 2011-September 2014). Students review the video and answer questions.
Grade Level: 6-8
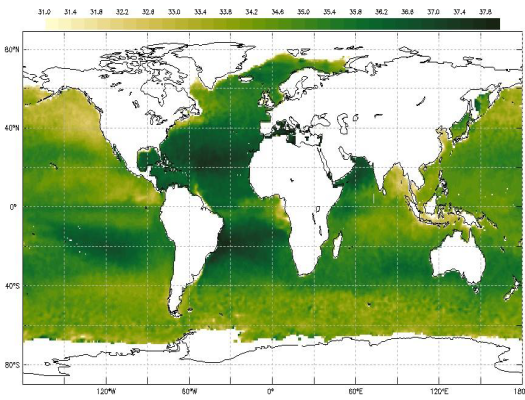
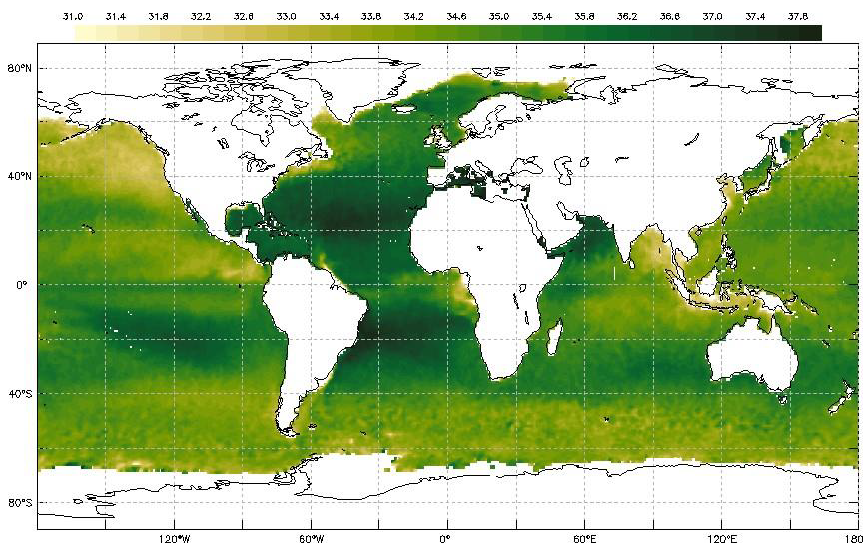
Exploring salinity patterns is a great way to better understand the relationships between the water cycle, ocean circulation, and climate.
Previous
Next
Grade Level: 6-8
Students review an animation of monthly average wind speed at 10 meters above the ocean surface for our global ocean to analyze the relationship between winds and ocean surface currents.
Grade Level: 6-8
In this mini lesson, students use in-water profiles of historical ocean data to analyze how sea surface salinity varies with depth.
Grade Level: 6-8
This mini-lesson features time-series graphs of mean salinity at the surface for the Arctic and Antarctic regions. A series of questions guides students in their analysis.
Grade Level: 6-8
This NASA visualization shows sea surface salinity observations (September 2011-September 2014). Students review the video and answer questions.
Grade Level: 6-8
Exploring salinity patterns is a great way to better understand the relationships between the water cycle, ocean circulation, and climate.
Ocean Circulation Patterns landing page. Explore maps, graphs, data, and related education resources. These resources include lesson plans, mini lessons, activities, and datasets for teachers and students.


