color hydrosphere icon
Just one moment,
loading Hydrosphere...

Featured Lesson Plans

Grade Level: 6-8, 9-12

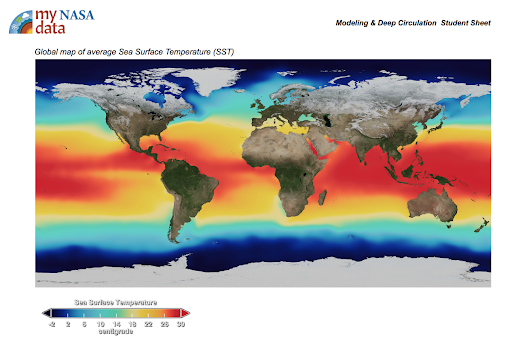
In this experiment, students make a claim about the cause of ocean currents and then develop a model to explain the role of salinity and density in deep ocean currents.  This lesson is modified from "Visit to an Ocean Planet" Caltech and NASA/Jet Propulsion Laboratory.

Grade Level: 6-8, 9-12

In this activity, students make a claim about the cause of ocean currents and then develop a model to explain the role of temperature and density in deep ocean currents.  This lesson is modified from "Visit to an Ocean Planet" Caltech and NASA/Jet Propulsion Laboratory.

Grade Level: 6-8, 9-12

Students analyze the relationship between sea surface height and ocean surface currents by graphing sea height using satellite data.  Note: This lesson is modified from NASA's TOPEX/Poseidon lesson plan.

Grade Level: 9-12

This investigation is part of the NASA: Mission Geography Module "What are the causes and consequences of climate change?" that guides students through explorations in climatic variability and evidence for global climate change. 

Google document icon.
Google slides icon.
Grade Level: 6-8, 9-12

Students will examine a 2014-2015 El Niño Southern Oscillation (ENSO) event to identify relationships among sea surface height, sea surface temperature, precipitation, and wind vectors.

Grade Level: 3-5, 6-8, 9-12

The Earth System Satellite Images, along with the Data Literacy Cubes, helps the learner identify patterns in a specific image.