Lesson Plans
Graphing Sea Level Slopes and Surface Currents
Overview
Students analyze the relationship between sea surface height and ocean surface currents by graphing sea height using satellite data. Note: This lesson is modified from NASA's TOPEX/Poseidon lesson plan.
Materials Required
- Copy of Student Data Sheet per student
- Pencil
- Ruler or straight edge (optional)
Procedure
Engage Prior Knowledge:
-
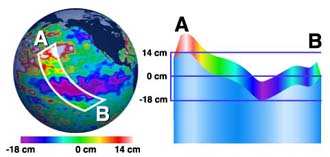
Display the image below for the class. Have students work with their peers to identify and discuss what they notice about the ocean's surface. Ask students to brainstorm tools that they would use to measure the change in this part of the Atlantic Ocean.
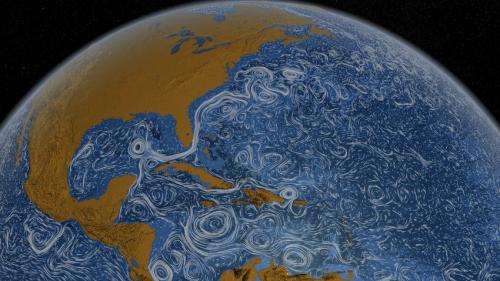
Credit: NASA - Students share out their ideas. Common ideas may include a thermometer to measure temperature, ruler to measure depth or distance from the coast. Tell students that the height of the ocean also changes. Ask students to brainstorm reasons why the ocean's height changes. Possible ideas may include tidal waves, tsunamis, etc.
Orient To The Map:
- Distribute the Student Sheet.
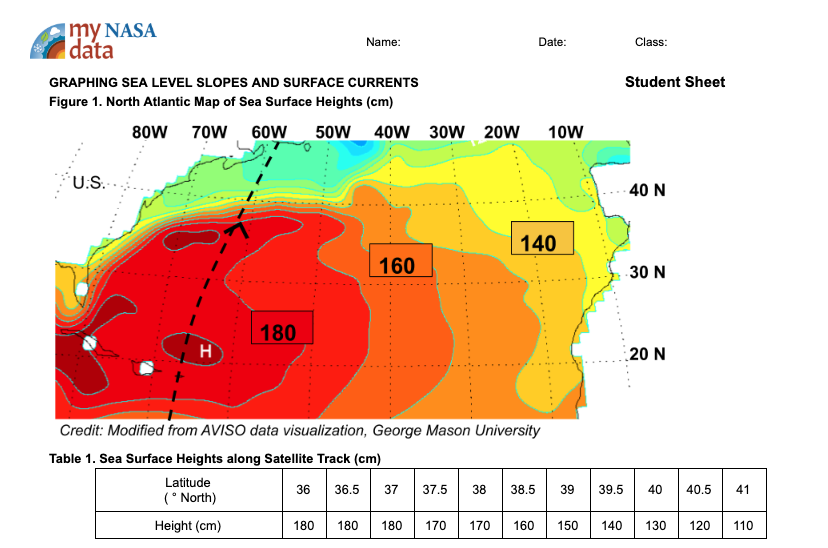
- Examine Figure 1.'s map of the North Atlantic Ocean which shows part of the ground track of an orbit of the satellite carrying an altimeter to measure sea height. The part of the ground track of interest for this activity is between 36° and 41° N latitude.
Discuss the Data:
- Discuss with the students that sea surface height is the measurement of the height of the ocean surface relative to the mean height of the ocean when at rest caused by gravity (the geoid). The heights (cm) are listed at regular intervals measured along the ground track of the instrument; these data are provided in Table 1.
- Review sea surface height data in Table 1. Sea Surface Heights along Satellite Track (cm). Relate these data to the image in Figure 1. Direct students to the ground track line and identify the contour lines of the ocean's surface. Deep reds indicate the highest level of the ocean surface while the blues indicate the lowest level. Model for the students how to read the contour lines.
- Ask students to describe what they see.
- Where are the highest hills? Where there is deep red.
- Lowest valleys? Where blue is shown.
- What is the shape of the ocean surface? Most of the image indicates a hill at the bottom left that extends Northeast. It suddenly drops off near the coastline and as it moves toward the Northeast waters towards Europe.
- Where are the highest slopes found? Where contour lines are close together; where the reds and greens meet.
- Gentle slopes? Where you find the greatest distance between contour lines like in the bottom section.
Plot the Data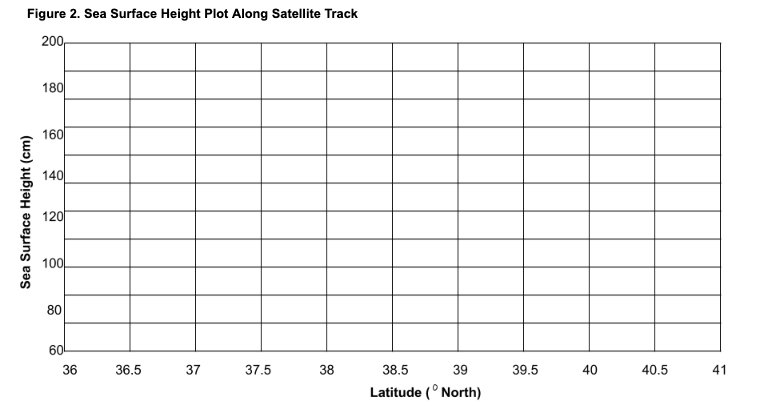
- Direct students to plot the data provided in the table on the sea surface height graph [Fig. 2]. Students should connect adjacent plotted points with solid straight lines.
Analyze the Data
- What do these data indicate? The ocean's surface is not flat but changing. There are topographic highs and lows on the ocean's surface.
- Have students model with their pencil the movement of water along the satellite track. The pencil's point should face the direction where the contour lines are closest together. Hold the pencil at an angle so that its point faces downhill; this models the direction that water will flow.
- What may cause these changes in the surface? Winds, density differences due to temperature and salinity
- The surface of the real ocean is constantly changing as winds and density differences cause gentle hills and valleys to form. Although these slopes are very small when compared to those on land, surface water responds to these changes in topography as it would on land, by starting to move (uphill) (downhill).
- Explain to students that surface currents are strongest on the steepest slopes and weakest on the gentlest slopes.
- Where is the Gulf Stream current the strongest? Where the contour lines are closest. Weakest? Where the contours are widely spaced apart.
Apply the Data:
- Remind students of the Coriolis Effect.
- On Earth, surface water set in motion is deflected about 90° to the right of its initial direction in the Northern Hemisphere and to the left in the Southern Hemisphere. This deflection is due to Earth's rotation.
- To model the current that results from this deflection, direct students to draw a 90° line to the right off of the satellite track line. This indicates the direction of deflection in the Northern Hemisphere.
- Ask students, "Toward what direction is the Gulf Stream flowing? northeast
Disciplinary Core Ideas:
- ESS2A: Earth Materials and Systems
- ESS2B: Plate Tectonics and Large-Scale Systems
- ESS2C: The Role of Water in Earth’s Surface Processes
Crosscutting Concepts:
- Scale, Proportion, and Quantity
Science and Engineering Practices:
- Developing and Using Models
- Planning and Carrying out Investigations
- Analyzing and Interpreting Data
- Describe the use of a radar altimeter to measure sea surface height.
- Plot sea surface height data.
- Describe the relationship between the slope of the sea surface and the direction and speed of ocean surface currents.
- How does the Atmosphere interact with Hydrosphere?
- How does energy and matter flow within the Hydrosphere?
- How does the ocean's surface change over time and space?
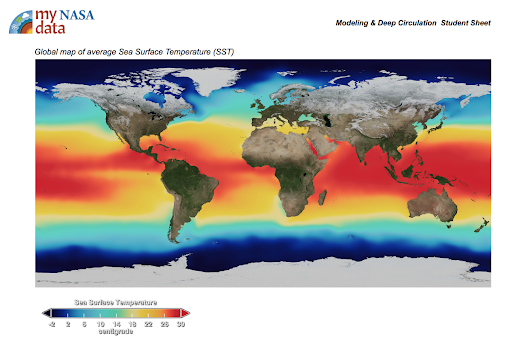
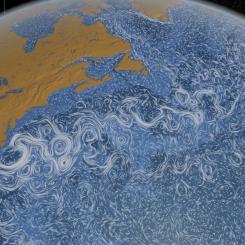
Our home, the Earth, experiences some of the most varied and interesting weather in the Solar System. This is because the Earth is actually a water-world, with some 70% of its surface covered by a vast, deep ocean. The world-ocean is a huge sink for solar energy. Through currents, the ocean transports this energy as heat, and releases it back into the atmosphere as water vapor, which is then returned back to the oceans and land as rain or snow. This completes the hydrologic cycle.
Credit: NASA
How can we measure and track changes in the oceanic heat-budget? We need to know both ocean currents and heat storage of the ocean. Like winds blow around the highs and lows of atmospheric pressure, ocean currents flow around highs and lows of oceanic pressure that can be determined from the height of sea surface, called ocean surface topography. Ocean current velocity can thus be computed from the slope of the ocean surface. Furthermore, as water heats up, it expands, and as it cools, it contracts, affecting the height of sea surface as well. Measuring the ocean surface topography thus gives the required information for studying global ocean circulation and the ocean's heat budget. Regular scanning of the ocean surface to maintain a database of ocean surface topography can help predict short-term changes in weather and longer-term patterns of climate.
Ocean Surface Topography
Topography is the configuration of a surface, including its relief. The topography of the sea surface is influenced by both gravity and ocean circulation.
The actual shape of the Earth is not a perfect sphere -- it's not even a perfect ellipsoid (which would account for the effect of its rotation). If you measure the strength of the gravity field across the Earth's surface, you will find local variations caused by irregularities in the crust, which produce an irregular figure called the geoid -- the actual shape of the Earth. To find the surface caused by ocean circulation, we mathematically remove the sea height caused by gravity (the geoid) and create maps of ocean topography. We then calculate the speed and direction of ocean currents similar to how meteorologists use atmospheric pressure maps to calculate winds.
Altimetry is the measurement of the height of the sea surface above (or below) some reference level. Every 10 days, Jason-1 measures heights of more than 90% of the world's ice-free oceans with the radar altimeter and completes 127 revolutions, or orbits, around the Earth.
To measure sea surface height we need the satellite's position in its orbit and the height between the satellite and the ocean's surface. We may also have to correct for variable amounts of water vapor in the lower atmosphere and free electrons in the upper atmosphere. Both of these can delay microwave pulses.
For more information on the geoid, visit NOAA's "What is the geoid? - NOAA's National Ocean Service" resource.
- Familiarity with the Coriolis Effect
- Basic understanding of surface currents
- Know how to read a topographic map
- Understand how to plot data on graph
- Know the basic elements of maps and globes
- Many students struggle to understand that the ocean's surface is constantly changing- it is a dynamic surface of hills and valleys. Many students believe that the ocean surface is consistently level, without relief.
- Geography Standard 1, Grades 6-8 Knows the purposes and distinguishing characteristics of different map projections, including distortion on flat-map projections Geography Standard 1, Grades 9-12 Knows the characteristics and uses of geographic technologies (e.g., geographic information systems (GIS) and satellite-produced imagery)
The ocean surface is not level but has broad, gradual hills and valleys created by surface winds and density differences. Surface currents flow around the sides of these hills and valleys. Measuring this sea surface topography is a challenging task. One measuring device is the TOPEX/Poseidon radar altimeter mounted on an Earth-orbiting satellite. This device sends radar beams down to the sea surface, where they are reflected back to the satellite. The round-trip travel times for the beams allow scientists to measure the satellite to sea surface distance to within a few centimeters. The satellite-derived sea surface elevations are then compared to those that the sea surface would have if the oceans were still (no currents, waves, etc.). Specifically, the elevations of the imaginary still ocean are subtracted from those calculated from the satellite's data. The height differences show where the ocean's hills and valleys are and the slope of the surface between them. The following activity uses some of these sea height differences, calculated from TOPEX/Poseidon data to investigate the relationship between sea surface topography and ocean surface currents.
Credit: Visit to an Ocean Planet, NASA TOPEX/Poseidon
- Biological oceanographers and marine biologists study plants and animals in the marine environment. They are interested in the numbers of marine organisms and how these organisms develop, relate to one another, adapt to their environment, and interact with it. To accomplish their work, they may use field observations, computer models, or laboratory and field experiments.
- Chemical oceanographers and marine chemists study the composition of seawater, its processes and cycles, and the chemical interaction of seawater with the atmosphere and seafloor. Their work may include analysis of seawater components, the effects of pollutants, and the impacts of chemical processes on marine organisms. They may also use chemistry to understand how ocean currents move seawater around the globe and how the ocean affects climate or to identify potentially beneficial ocean resources such as natural products that can be used as medicines.
- Geological oceanographers and marine geologists explore the ocean floor and the processes that form its mountains, canyons, and valleys. Through sampling, they look at millions of years of history of sea-floor spreading, plate tectonics, and oceanic circulation and climates. They also examine volcanic processes, mantle circulation, hydrothermal circulation, magma genesis, and crustal formation. The results of their work help us understand the processes that created the ocean basins and the interactions between the ocean and the seafloor.
- Physical oceanographers study the physical conditions and physical processes within the ocean such as waves, currents, eddies, gyres and tides; the transport of sand on and off beaches; coastal erosion; and the interactions of the atmosphere and the ocean. They examine deep currents, the ocean-atmosphere relationship that influences weather and climate, the transmission of light and sound through water, and the ocean's interactions with its boundaries at the seafloor and the coast.
- Standalone Lesson (no technology required)
Complementary Lesson Plans

Complementary Mini Lessons
Complementary Interactives


Grade Band
- 6-8
- 9-12
Time
- 50 minutes
Visualization Tool
NGSS Three Dimensional Learning
- See drop-down menu at the bottom of the page