Lesson Plans
Modeling Temperature and Deep Ocean Currents
Overview
In this activity, students make a claim about the cause of ocean currents and then develop a model to explain the role of temperature and density in deep ocean currents. This lesson is modified from "Visit to an Ocean Planet" Caltech and NASA/Jet Propulsion Laboratory.
Materials Required
- Approximately 9 x 13 x 3 inch glass dish (or aluminum pans)
- Cold tap water (varies, < or equal to 85°F degrees)
- Hot tap water (varies, approximately 120°F degrees)
- Waterproof zip-seal bags
- 2 Clothespins (or small clamps)
- 2 Different colors of food coloring
- 2 Eye droppers
- Rock
- Ice cubes, or a chemical cold pack
- Map of deep ocean currents
- Map of sea surface temperature
- Towels
- Student Sheet
- Optional: aprons
PREPARATION
- It is important to do this activity before your students do it. This will give you a chance to see and work out any potential problems beforehand. Gather the supplies or send a supply list home with the students. Make sure that the students mark their names on anything they bring to class that will be returned home.
Procedure
Engage the Learner:
-
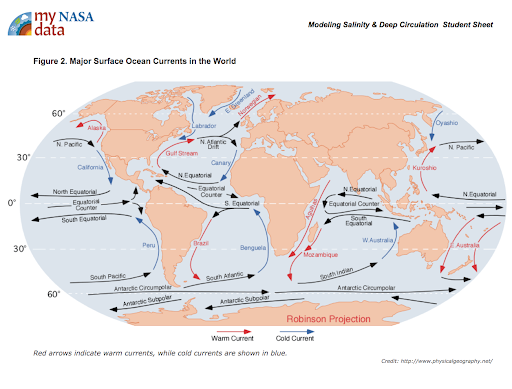
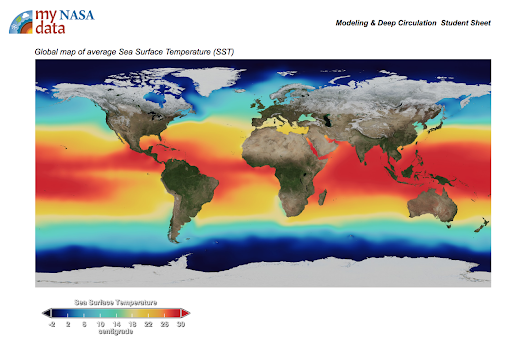
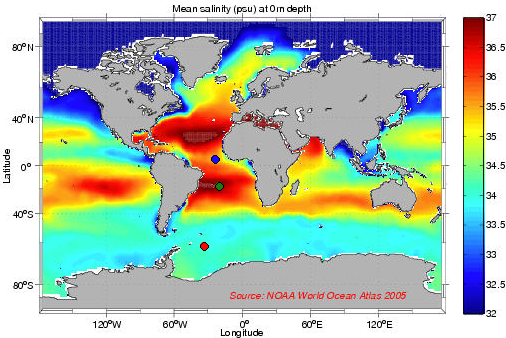
Display the maps of surface ocean currents and sea surface temperature [Figs. 1 and 2].
|
|
-
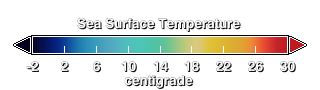 Describe the color bar; it shows the long-term average sea surface temperature, with red and yellow depicting warmer waters and blue depicting colder waters.
 -
Have the students note the difference between warm and cold currents.
-
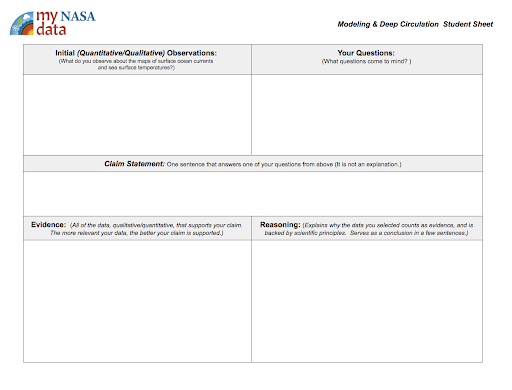
Distribute the Student Sheet. Direct students to write their observations down on Student Sheet in the Initial (Quantitative/Qualitative) Observations section.
Ask Questions:
- Next, have students brainstorm questions that come to mind about these data and how they may be related. Students write their questions in the Your Questions section.
- Guide students through the process of generating a claim statement. Ask the students to write a claim that addresses these relationships in the Claim Statement section. Example., Surface currents control the water’s temperature.
Carry Out the Investigation:
First model the experiment for the students before having them conduct the investigation with their group:
- Fill the glass pan with tap water. Let the pan rest for a few minutes while the water settles.
- Place a rock in a plastic bag and fill the bag with hot water. Seal the bag, and use the clothespin to clip it to one corner of the glass pan.
- Fill another bag with ice cubes or the chemical cold pack, and clip the bag to the opposite corner of the pan.
- Use one of the droppers to add four drops of food coloring to the water next to the ice cube.
- Use the other dropper to add four drops of a different color of food coloring next to the bag of hot water.
Analyze the Results:
- Allow students to observe food coloring for several minutes.
- What happened to the water closest to the bag with the hot water and rock? Why do you think that is?
- The water moved to the top and toward the cold water.
- What happened to the water close to the ice/cold pack? Why?
- The water sunk and moved towards the hot water.
Interpret the Data:
A. Allow time for students to document their observations in the Evidence section of the dataset.
B. Provide the following questions to help students with their observations/evidence:
- Is cold water more or less dense or lighter (more or less dense) than warm water? Denser
- Why did the water move? As water-cooled near the ice pack, it started to sink; warm water at the surface was pulled in to replace the sinking water.
- Describe how the water color changes or stays the same. In some places, the colors mix but in others, the warm water stays together towards the surface and cold water masses stay together near the bottom.
- Why do the color seem to mix in some places but not the other? In some places, the waters move past one another and mix. During this time, their temperatures change.
- If we left this pan sitting for hours, what would we expect to find? The water would eventually become the same temperature and be the same color.
Explain the Results:
-
Facilitate a discussion based on the following points:
- The world’s oceans are heated at the surface by the Sun. In fact, over half the heat that reaches the Earth from the Sun is absorbed by the ocean's surface and most of this heat is received along the equator. Incoming solar radiation at the equator is about double of what our polar regions receive. Therefore the sea surfaces are much warmer along the equator than at the poles. Currents that originate near the equator move this heat to the poles; currents that flow from the poles are cold.
- When the water temperature cools, it will sink because the cold water is denser than warm water. The molecules of cold water are much more highly concentrated than the molecules of warm water, meaning there are more water molecules packed into the space of the cold water mass than a warm water mass. The greater number of molecules in the cold water makes the water denser than warm water so it will sink to the bottom, mixing with the warmer water. After this mixing occurs the higher density water sits along the bottom and the lower density water has risen to the top. However, some of the heat energy in the warm water will be transferred to molecules of cold water so the water will become mixed to a certain extent and the colors of the two masses will mix. When the warm water is placed on top of the cold water, the denser water is already on the bottom so the less dense warm water will just sit on top of the more dense water. The warm water will stay the same color and the cold water will remain its original color.
-
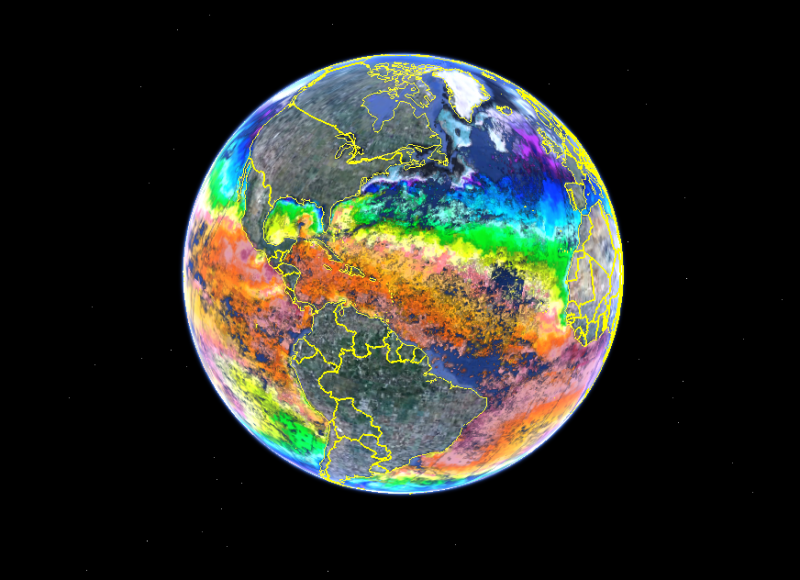
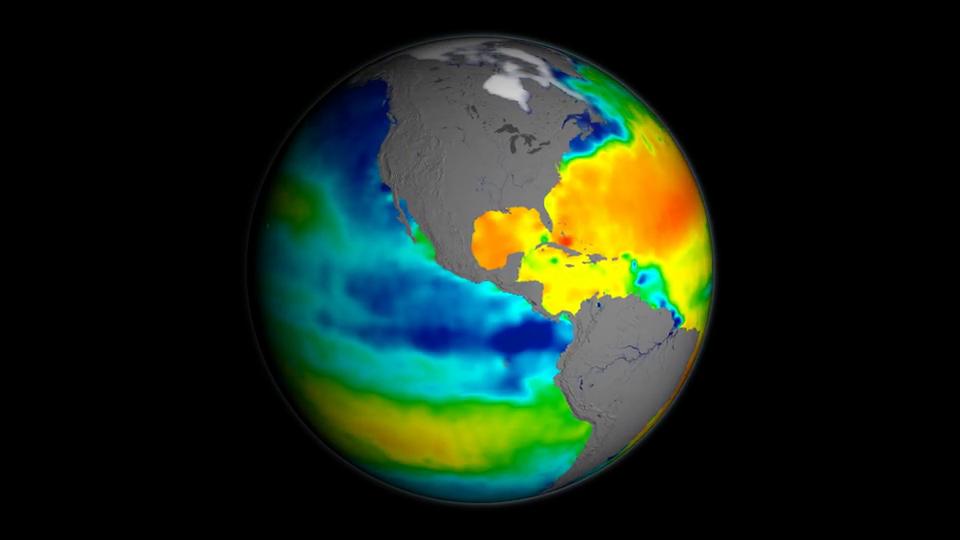
Queue the Sea Surface Temperature animation. Revisit the color bar - red and yellow depicting warmer waters and blue depicting colder waters.
-
Run the video of Sea Surface Temperature.
-
Invite students to make observations of what they see. The most obvious feature of this temperature map is the variation of the temperature by latitude, from the warm region along the equator to the cold regions near the poles. Another visible feature is the cooler regions just off the western coasts of North America, South America, and Africa. On these coasts, winds blow from land to ocean and push the warm water away from the coast, allowing cooler water to rise up from deeper in the ocean.
-
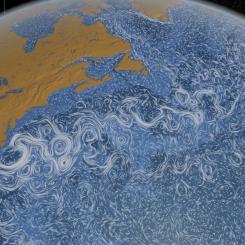
Display the following image, drawing students' attention to the Atlantic Ocean basin and ask what is happening here? The Atlantic features a circulation pattern of warm surface current, including the Gulf Stream, that brings warm surface waters from the tropics northward into the North Atlantic. There, in the seas surrounding Greenland, the water cools; sea ice forms removing freshwater from the water making it denser, sinking to great depths and changes direction. What was once warm surface water heading north turns into cold deep water going south. This overturning is one part of the vast conveyor belt of ocean currents that move heat around the globe.
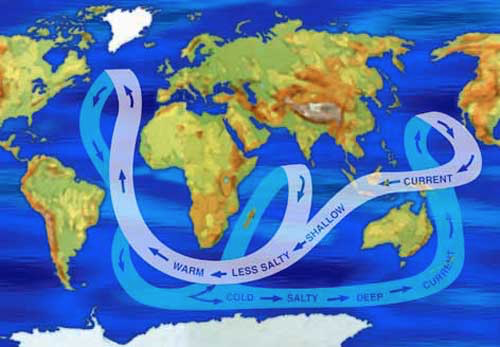
Thermohaline Circulation Credit: NASA -
Present the following question to the students: What effect does increasing air temperatures have on this conveyor belt that distributes heat around the world? Increasing air temperatures will cause an increase in the melting of land and sea ice in the polar regions. This would release more freshwater and may insert warmer water into the polar regions and may affect the temperature-driven deep water circulation.
Construct Explanations:
A. Engage students in a discussion around the following questions:
- Which has the greatest density (the amount of “stuff” in a given amount of space), cold water or warm water? Explain. The molecules of cold water are much more highly concentrated than the molecules of warm water, meaning there are more water molecules packed into the space of the cold water mass than a warm water mass. The greater number of molecules in the cold water makes the water denser than warm water so it will sink to the bottom, mixing with the warmer water.
- Where do you expect to find the coldest ocean water? warmest? Polar regions; Equatorial region
- What may explain why the surface waters at the Equator have the highest temperatures? Over half the heat that reaches the Earth from the Sun is absorbed by the ocean's surface and most of this heat is received along the equator.
- What Earth process/es explains why the surface temperature values (Figure 1) are so high at the equator and mid-latitudes? Students may say that the water is warmer; the sun’s radiation is more intense at the equator; there is greater evaporation in this area.
B. Now have students return to their student sheet and write the scientific principles that affect the movement of water based on temperature. They should connect scientific understanding to their observations in the Evidence section.
- How does our understanding of the science processes affecting the movement of water in the oceans based on their temperature values relate to their Claim Statement?
- Is your Claim supported by your evidence and backed by our scientific understanding of the ocean circulation? Why or Why Not?
- Have students share their Claim Statements with the class and how their deeper dive into temperature-driven currents have changed their understanding of the Hydrosphere.
Disciplinary Core Ideas:
- ESS2A: Earth Materials and Systems
Crosscutting Concepts:
- Cause and Effect
Science and Engineering Practices:
- Developing and Using Models
The Student will:
- Develop a claim about the cause of ocean currents
- Model to explain the connection between temperature and density in ocean currents.
-
How do ocean properties affect the movement of water?
Over half of the heat that reaches the Earth from the Sun is absorbed by the ocean's surface and most of this heat is received along the equator; incoming solar radiation at this location is about double that received at the poles. Therefore the sea surfaces are much warmer along the equator than at the poles. Currents that originate near the equator move this heat to the poles; currents that flow from the poles toward the equator are cold.
The world's ocean is heated at the surface by the sun, and this heating is uneven for many reasons. Earth's rotation, revolution around the sun, and tilt all play a role, as do the wind-driven ocean surface currents. This animation shows the long-term average sea surface temperature, with red and yellow depicting warmer waters and blue depicting colder waters. The most obvious feature of this temperature map is the variation of the temperature by latitude, from the warm region along the equator to the cold regions near the poles. Another visible feature is the cooler regions just off the western coasts of North America, South America, and Africa. In these regions, the combination of Earth's rotation and alongshore winds push water away from the coast, allowing cooler water to rise from deeper in the ocean. The long-term average (or "climatology") of sea surface temperature used in this animation came from the World Ocean Atlas 2005.
- Ability to read maps
- Knowledge of safety procedures while conducting science experiments and models
- Basic understanding of density
- Earth’s oceans are separate individual bodies of water and are not connected.
 Sea Surface Temperature (SST) is a measure of the energy due to the motion of molecules at the top layer of the ocean. Depending on the sensor, spaceborne measurements give us an unprecedented global measurement of sea surface temperatures every few days to a week. Temperatures are measured from approximately 10 µm below the surface (infrared bands) to 1mm (microwave bands) depths using radiometers.
Prior to the 1980s measurements of SST were derived from instruments on shorelines, ships and buoys. The first automated method of gathering SST was by measuring water flowing through the input ports of ocean faring ships. While this method obtained a significant quantity of useful SST data there were some shortcomings. The depth of the input ports of different ships can vary greatly from ship to ship. In a stratified ocean these different depths can have different temperatures. This method also resulted in rigorous sampling along major shipping routes but a dearth of information about the vast majority of the world's oceans.
Since the 1980's most of the information about global SST has come from satellite observations. Instruments like the Moderate Resolution Imaging Spectroradiometer on board (MODIS) onboard NASA’s Terra and Aqua satellites orbit the Earth approximately 14 times per day, enabling it to gathering more SST data in 3 months than all other combined SST measurements taken before the advent of satellites.
- Biological oceanographers and marine biologists study plants and animals in the marine environment. They are interested in the numbers of marine organisms and how these organisms develop, relate to one another, adapt to their environment, and interact with it. To accomplish their work, they may use field observations, computer models, or laboratory and field experiments.
- Chemical oceanographers and marine chemists study the composition of seawater, its processes and cycles, and the chemical interaction of seawater with the atmosphere and seafloor. Their work may include analysis of seawater components, the effects of pollutants, and the impacts of chemical processes on marine organisms. They may also use chemistry to understand how ocean currents move seawater around the globe and how the ocean affects climate or to identify potentially beneficial ocean resources such as natural products that can be used as medicines.
- Geological oceanographers and marine geologists explore the ocean floor and the processes that form its mountains, canyons, and valleys. Through sampling, they look at millions of years of history of sea-floor spreading, plate tectonics, and oceanic circulation and climates. They also examine volcanic processes, mantle circulation, hydrothermal circulation, magma genesis, and crustal formation. The results of their work help us understand the processes that created the ocean basins and the interactions between the ocean and the seafloor.
- Physical oceanographers study the physical conditions and physical processes within the ocean such as waves, currents, eddies, gyres and tides; the transport of sand on and off beaches; coastal erosion; and the interactions of the atmosphere and the ocean. They examine deep currents, the ocean-atmosphere relationship that influences weather and climate, the transmission of light and sound through water, and the ocean's interactions with its boundaries at the seafloor and the coast.
- Internet Required
- Teacher computer/projector only
Complementary Lesson Plans

Complementary Mini Lessons
Complementary Interactives

Grade Band
- 6-8
- 9-12
Time
- 90 minutes
Visualization Tool
NGSS Three Dimensional Learning
- See drop-down menu at the bottom of the page
Related Resources
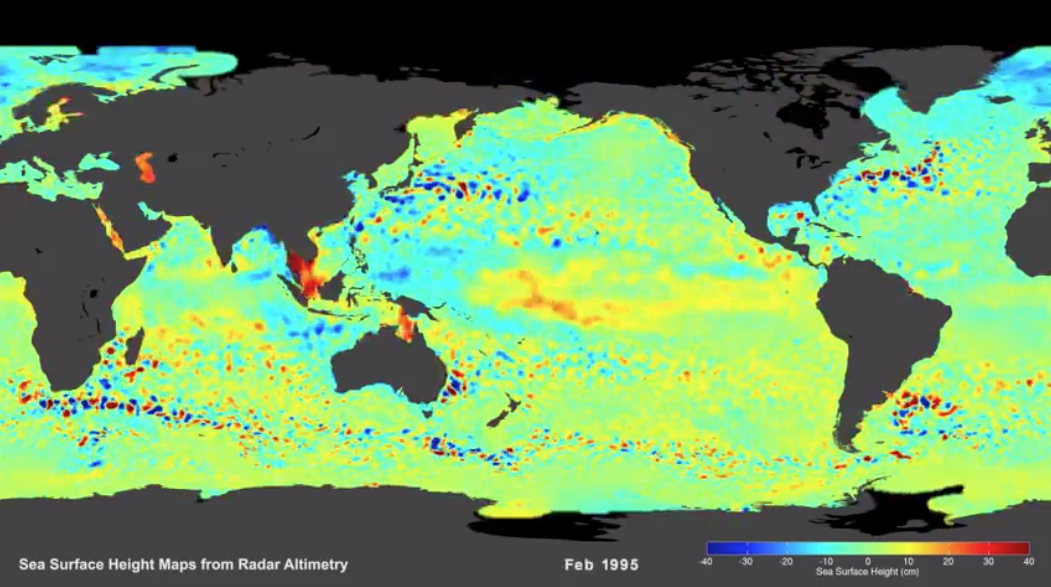
- Creating Your Own Sea Surface Height Model
- Tracking Monthly Salinity Changes in Our Ocean
- Historical Ocean Salinity Data: Annual Mean Data
- Ocean Surface Salinity Data
- Inferring Relationships Among Sea Surface Salinity & Other Variables in the Nor…
- Daily Sea Surface Temperatures
- Historical Ocean Density Data: Annual Mean Data
- Historical Ocean Temperature Data: Annual Mean Data
- Instructional Strategies for the Earth Science Classroom
- Data Literacy Cube Guide