Lesson Plans
Inferring Relationships Among Sea Surface Salinity & Other Variables in the North Atlantic
Overview
Students will observe monthly satellite data of the North Atlantic to identify relationships among key science variables that include sea surface salinity (SS), air temperature at the ocean surface (AT), sea surface temperature (ST), evaporation (EV), precipitation (PT), and evaporation minus precipitation (EP). They work in teams to analyze monthly environmental data to find the data set that most closely corresponds to sea surface salinity patterns.
Materials Required
- Graphic Organizer
- Sticky notes
- Markers, pens, or pencils
- Data Literacy Cubes (or die) and questions
- Data Analysis Sheet
- Computer with internet access (one per group or one to one) to link: Analyzing Monthly Environmental Data
or - Copies of Monthly images in PDF format:
Procedure
Engaging Prior Knowledge:
1. Brainstorm with students the different characteristics (physical or chemical properties) of ocean water. Students' ideas may include the following:
- Is salty (contains minerals and dissolved gases)
- Has a high heat capacity
- Varies in quantities of density, temperature, and salinity
- Changing sea level
- Responds to external forces such as Moon's gravity, winds, etc.
- Can form ice when water is cooled
- and many, many more
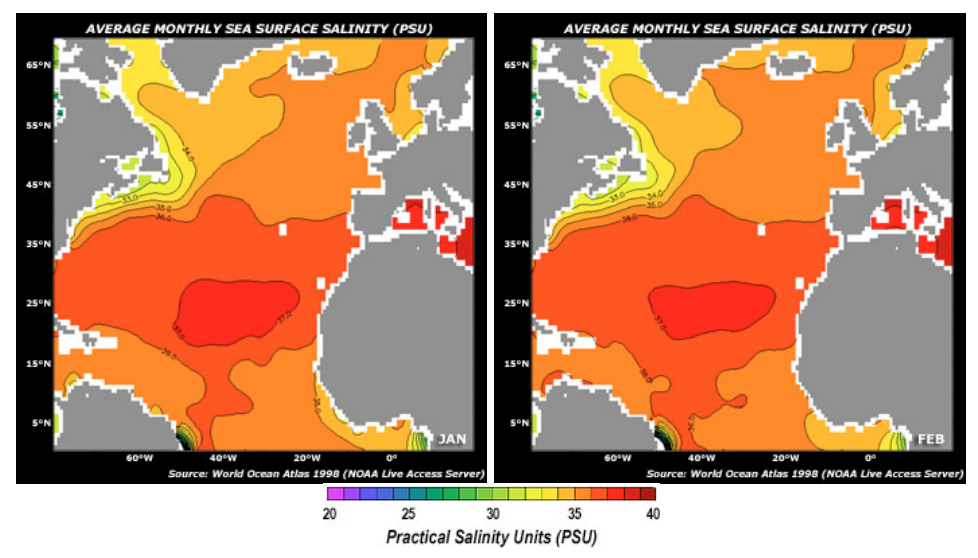
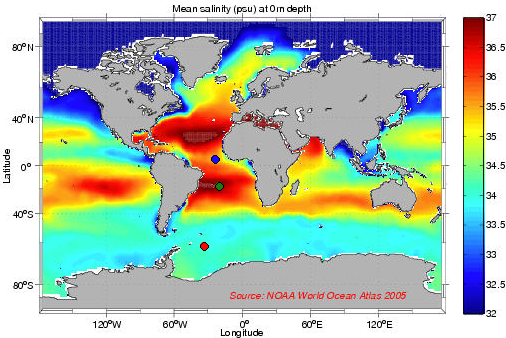
2. Responding to the likely most common characteristic is the ocean's saltiness. Show the following mapped image of Sea Surface Salinity.
-
Explain this variable (Average Monthly Sea Surface Salinity). Review the color bar and discuss Practical Salinity Units (PSU) with students.
-
Salinity in the ocean is defined as the grams of salt per 1000 grams of water. One gram of salt per 1000 grams of water is defined as one practical salinity unit or one PSU.
-
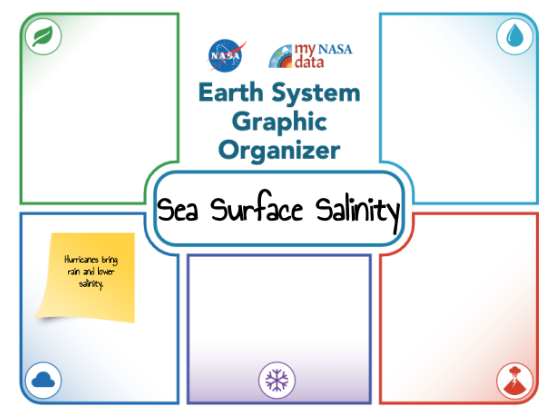
3. Present the Earth System Graphic Organizer on the board/projector. Identify and describe each of the spheres of the Earth System. Write Sea Surface Salinity in the center.
4. Students brainstorm and write one scientific process that may affect the ocean's salinity per note. Provide students with multiple sticky notes to identify at least two processes. They post the note in the sphere (on the board or on the screen’s section) that it originates in.
Observing, Asking, & Claiming:
1. Distribute the Map Cube (or die) and the question guides to student groups. Also, distribute the Student Sheet.
- Model for students how to observe common characteristics of the maps using the Cubes. Students write down their observations (and ones shared by their peers) in #1: Initial (Quantitative/Qualitative) Observations on the Student Sheet.
- Assign each group a different set of dates (ex., Jan & Feb - Group A, Mar & Apr - Group B, etc.) and have students analyze their images and document their findings. Students develop questions and write them in Cell #2: Your Questions.
- Students share their findings. They summarize the class's findings in Cell #1.
- Summarize these data into concise statements about Sea Surface Salinity in the North Atlantic:
Possible student examples include the following:
- The greatest range in salinity in the mapped images of the North Atlantic are found in the summer months.
- There is a bulls-eye shape in the equatorial region of the Atlantic that shows high salinity values.
- The salinity of Western South America decreases in the spring and summer.
2. Show & describe to the following list of science variables students.
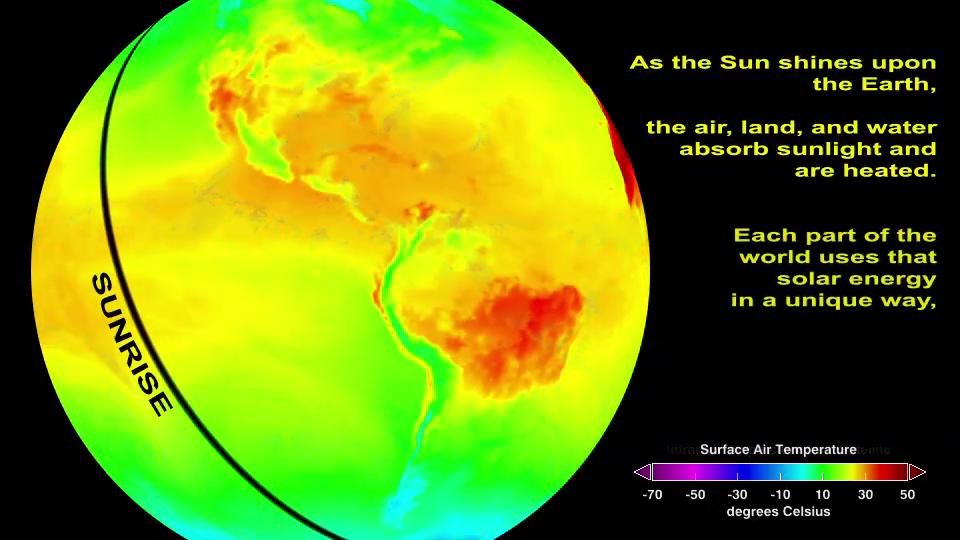
- Air Temperature (AT) - Monthly Average Air Temperature at the Ocean’s Surface (℃)
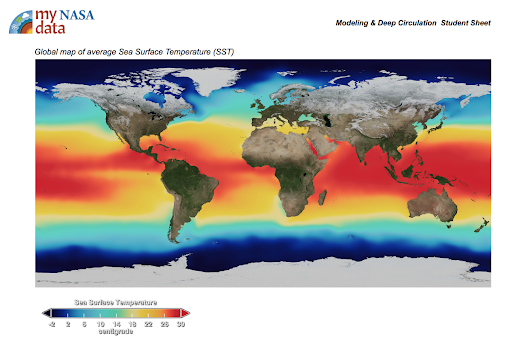
- Sea Surface Temperature (ST) Monthly Average Sea Surface Temperature (℃)
- Evaporation (EV) Monthly Average Evaporation Rate (mm per 3 hours)
- Precipitation (PT) - Monthly Average Precipitation Rate (mm per 3 hours)
- Evaporation minus Precipitation (EP) - Monthly Average Evaporation minus Precipitation Rate (mm per 3 hours). This is a calculation of the difference between evaporation (E) and precipitation (P) and indicates a net gain or loss of water by the ocean.
3. Ask students to predict what variables would have similar patterns to what they observed in SS. Students draft a Claim Statement into Cell 3: Claim Statement.
Investigating and Collecting Evidence:
- 1. Challenge students to find the data set that most closely corresponds to sea surface salinity (SS) patterns. Students will work with a partner to review the mapped data of these variables as they relate to SS and document evidence. Note: Students may wish to start with the data set that they feel is most closely related to SS and progress to the other data sets. (Note: some evidence may support or not support their claims.)
- 2. To engage students in all data, students also answer the questions below about the different datasets. Review the Key Questions guiding the image analysis. Students should answer these first before completing their Claims-Evidence-Reasoning sheet.
KEY QUESTIONS:
-
AT-SS: Which months do you see the most variation in each type over the year for the mapped area of the N. Atlantic? Why do you think this happens?
Possible answers include (but are not limited to) the following:- AT has the largest variation Nov - Feb in the North Atlantic; likely due to the seasonal shift toward winter.
- The greatest range in SS in the mapped images of the North Atlantic are found in the summer months; likely due to land/sea ice melt during these hotter months which increases the amount of freshwater into the ocean
-
ST-SS: How does the surface water temperature relate to high salinity values? Low salinity values? Is this surprising? Why or why not?
Possible answers include (but are not limited to) the following:- Low SS values in the Northwest Atlantic do correspond to lower ST values; however, low SS off coastal Northeastern South America and coastal West Africa do not show the same relationship- ST values are high in these cases.
-
EV-SS: Do the highest evaporation rates occur over waters of the highest salinity? Is this surprising? Why or why not?
Possible answers include (but are not limited to) the following:- The highest rates of EV occur on the East coast of the US Sept - Feb. There may be a relationship among EV and SS as the highest rates of SS appear to be during the winter months, Jan - March. This is worth investigating further. This is surprising as one may not think that there would be more evaporation of ocean water during the winter months since it is cooler in the Northern Hemisphere during this time.
-
PT-SS: What is the relationship between precipitation rates and salinity? Is this surprising? Why or why not? When does the highest precipitation occur over the equator?
Possible answers include (but are not limited to) the following:- There is a positive correlation as areas of low precipitation show higher values of salinity.
- During July - Sept, the equatorial region experiences the greatest precipitation.
-
EP-SS: What is the relationship between SS and the EP? What is the environmental significance of the "0" line on the E-P map (i.e., the dark line between the yellow and green areas)? Possible answers include (but are not limited to) the following:
- Evaporation predominates in areas that are colored in shades of red.
- The areas that are colored green are dominated by precipitation.
- Salinity decreases at the ocean surface in areas where it rains more than evaporated (E-P<0), like in areas of strong atmospheric convection (e.g., equatorial) or at the middle latitudes. In subtropical zones, salinity increases where evaporation dominates over precipitation (E-P>0).
- The 0 line means that the same amount of water is being evaporated as it is being precipitated; there is no net gain or loss.
Reasoning With Scientific Principles:
- Guide students to return to the graphic organizer that was completed at the beginning of the class. How do these processes affect the distribution of salinity values in the Atlantic Ocean? What other processes did this activity remind you of?
- Ask students to identify what scientific principles are in effect that may control the relationships and patterns that they see? Possible answers include (but are not limited to) the following:
- Seasonal inputs of solar energy affect the distribution of heat in the Atmosphere and Hydrosphere.
- Surface ocean currents redistribute heat through the Atlantic Ocean.
- Seasonal precipitation events runoff watersheds into the Atlantic Ocean and decrease salinity values.
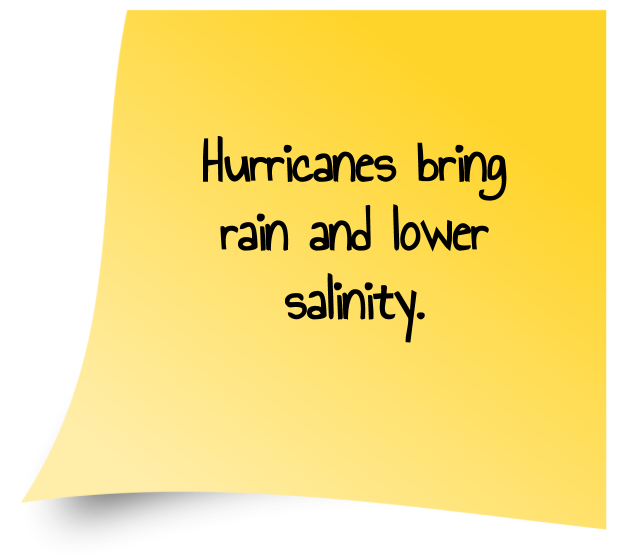
- Tropical cyclones forming over warm ocean waters near the equator distribute freshwater and decrease salinity.
- Dry winds cause increasing rates of evaporation.
- Evaporation removes freshwater in the form of water vapor and leaves salt behind in the water increasing its salinity.
- Increases in salinity cause the seawater to become denser. You can see on the map that the north and south Atlantic have high salinity – these are areas where there are strong winds and not much rain.
- Evaporation caused by dry winds removes water vapor and increases salinity.
- The formation of sea ice increases salinity.
Communicating Your Findings:
- Ask students to share what evidence they had to support their Claim. What evidence did they find that did not form support their claim?
- What scientific reasoning supported or did not support their claims?
Closing the Lesson:
Implement a “Three W’s” Closing Activity whereby students discuss or write:
- What are the two main ways that salinity is affected in the ocean’s surface waters that we explored? (Evaporation & Precipitation, runoff was also explored.)
- Why is this important to our understanding of Ocean Circulation? (Water is the main way energy is moved around the Earth system with ocean currents transporting enormous quantities of heat energy towards Earth’s poles.)
- What other areas of Earth would be affected in similar ways as the North Atlantic? Why? (The South Atlantic (and other ocean basins near the Earth’s equator) will be affected by evaporation and precipitation and its salinity values will be affected in the same way.)
Disciplinary Core Ideas:
- PS3B: Conservation of Energy and Energy Transfer
- ESS1C: The History of Planet Earth
Crosscutting Concepts:
- Patterns
- Cause and Effect
Science and Engineering Practices:
- Asking Questions and Defining Problems
- Developing and Using Models
- Analyzing and Interpreting Data
- Constructing Explanations and Designing Solutions
- Observe mapped satellite data of ocean-related variables and how they change over time and space
- Analyze mapped data of ocean-related variables to identify relationships among key variables
- Infer how the water cycle affects ocean salinity
- Communicate their findings to their classroom
- How does the environmental data of the Atlantic Ocean vary over time?
- How do changes in one of the Earth's systems affect the others?
Water Cycle
Earth's water cycle is dominated by ocean-atmosphere exchanges: globally, 86% of evaporation and 78% of precipitation occur over the ocean. Ocean surface salinity is a key tracer for understanding the freshwater fluxes into and out of the ocean system. This is because some parts of the water cycle decrease salinity (e.g., precipitation, groundwater flow to the ocean, river runoff) and some parts increase it (e.g., evaporation and freezing of seawater). With Aquarius data, scientists are able to relate ocean surface salinity variations to evaporation and precipitation, providing insight into how the ocean responds to seasonal and annual variability in the water cycle.
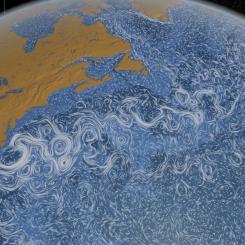
Ocean Circulation
Salinity plays a major role in how ocean waters circulate around the globe. Salinity changes can create ocean circulation changes that, in turn, may impact regional and global climates. The extent to which salinity impacts our global ocean circulation is still relatively unknown, but NASA's Aquarius mission helps advance that understanding by painting a global picture of our planet's salty waters.
Climate
Oceanographers believe that maintaining density-controlled ocean circulation is key to keeping ocean heat transport - and Earth's climate - in balance. Increases in ocean surface salinity in high latitudes can increase seawater density and speed up the deep overturning circulation in the ocean. Conversely, decreases in ocean surface salinity (e.g., by melting ice) may result in widespread decreases in seawater density, reducing its ability to sink. In a very simple model, decreasing ocean surface salinity in the North Atlantic would reduce the efficiency of the ocean "global conveyer belt" which helps to regulate global climate by moving heat from the tropics to higher latitudes.
21st Century Technology
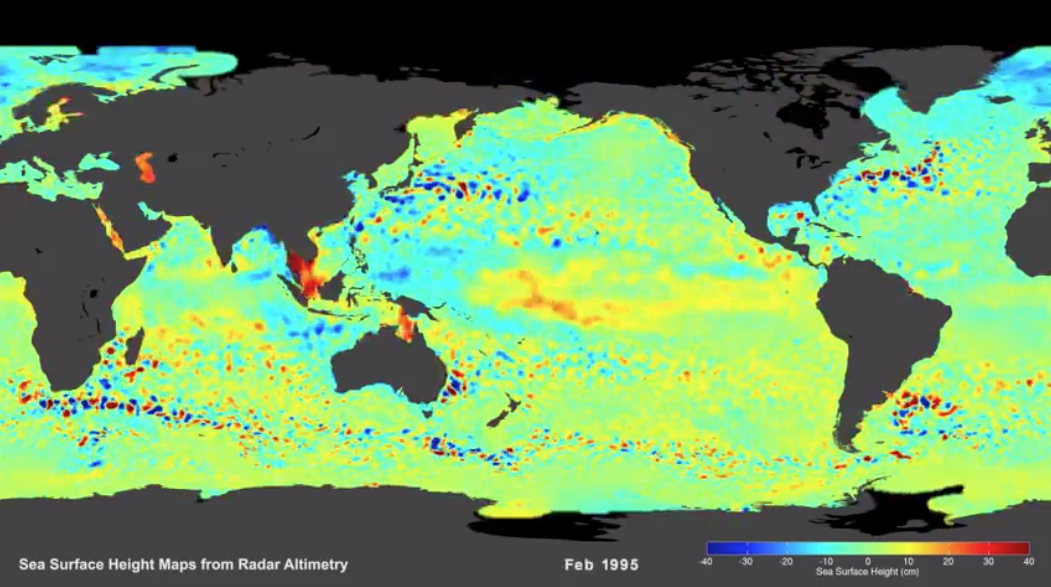
We know climate change can affect us, but does climate change alter something as vast, deep and mysterious as our oceans? For years, scientists have studied the world's oceans by sending out ships and divers, deploying data-gathering buoys, and by taking aerial measurements from planes. But one of the better ways to understand oceans is to gain an even broader perspective - the view from space. NASA's Earth-observing satellites do more than just take pictures of our planet. High-tech sensors gather data, including ocean surface temperature, surface winds, sea level, circulation, and even marine life. With the launch of Aquarius, NASA has collected its first-ever ocean surface salinity data. Information that satellites obtain help us understand the complex interactions driving the world's oceans today - and gain valuable insight into how the impacts of climate change on oceans might affect us on dry land.
- Students should have a basic understanding of the physical properties of ocean water.
- Students should be familiar with surface currents.
- Students should have a basic understanding of how to read and extract information on maps.
- Students should have a proficient understanding of Earth's water cycle.
- Oceans have the same salinity everywhere.
- Oceans get their salinity from table salt instead of understanding that ocean water’s “salt” is made of dissolved minerals from surface runoff (excess water from rain, snow or other sources that must flow over land).
- Many students struggle to differentiate between heat and temperature, the notion that transfer of heat will always result in a temperature rise if there is no phase change (gas->liquid, solid->liquid, etc.), and a misunderstanding of the concept of latent heat.
Sources:
- NASA Aquarius
- Ohio State University's Beyond Penguins and Polar Bears
Salt plays an important role in how the Earth system functions. It flows through Earth's ocean, the lifeblood of Earth's climate system. The ocean is roughly 3.5% salt and the concentration of dissolved salts in the ocean is referred to as salinity, which varies across the globe and over time. Just as too much or too little salt in our diets affects our health, so too do high and low salinity have profound effects on how the ocean circulates, how freshwater cycles around Earth and how our climate works. The concentration of salt on the ocean surface — the part of the ocean that actively exchanges water and heat with Earth's atmosphere — is a critical driver of ocean processes and climate variability. To better understand the regional and global processes that link variations in ocean salinity to changes in the global water cycle - and how these variations influence ocean circulation and climate - NASA built and launched Aquarius, the primary instrument aboard the international Aquarius/Satélite de Aplicaciones Científicas (SAC)-D observatory.
Aquarius made NASA's first space-based global observations of ocean surface salinity, flying 657 kilometers (408 miles) above Earth in a sun-synchronous polar orbit that repeated every seven days. This NASA Earth System Science Pathfinder mission mapped global changes in ocean surface salinity with a resolution of 150 kilometers (93 miles), showing how salinity changes from month to month, season to season and year to year. Scientists are combining Aquarius data with in-water measurements to generate operational maps of ocean salinity distribution.
Aquarius data have revealed interesting features in the global ocean, including a salty patch of water in the North Atlantic Ocean. Evaporation of water from this area leaves behind large amounts of salt, contributing to a high-salinity region.
Explore this video to observe some of the key findings listed below.
- Near the equator in the North Pacific Ocean, one of the wettest regions on the planet, heavy rainfall adds an abundance of water to the sea surface. This results in a band of low salinity water off the coast of Central America.
- Rivers also influence the amount of salt on the sea surface. At the mouth of the Amazon River, millions of gallons of freshwater flow into the Atlantic Ocean, resulting in a plume of low-salinity water.
- At high latitudes, the seasonal melting of sea ice causes a sharp decrease in sea surface salinity. In spring and summer, surface currents in the Labrador Sea transport low salinity water south, where it meets warmer, saltier water carried north by the Gulf Stream.
- The waters surrounding the Indian subcontinent vary in salinity due to geography and climate. To the west, an arid climate and lack of freshwater input yield the salty Arabian Sea. To the east, monsoon rains and freshwater outflow from the Ganges River keep the Bay of Bengal far less salty.
- Without satellite observations, these global changes would be largely invisible to us. Aquarius data are helping scientists to better understand our vast ocean, including how changes in ocean circulation and the water cycle may impact Earth's climate.
Credit: NASA
- Biological oceanographers and marine biologists study plants and animals in the marine environment. They are interested in the numbers of marine organisms and how these organisms develop, relate to one another, adapt to their environment, and interact with it. To accomplish their work, they may use field observations, computer models, or laboratory and field experiments.
- Chemical oceanographers and marine chemists study the composition of seawater, its processes and cycles, and the chemical interaction of seawater with the atmosphere and seafloor. Their work may include analysis of seawater components, the effects of pollutants, and the impacts of chemical processes on marine organisms. They may also use chemistry to understand how ocean currents move seawater around the globe and how the ocean affects climate or to identify potentially beneficial ocean resources such as natural products that can be used as medicines.
- Geological oceanographers and marine geologists explore the ocean floor and the processes that form its mountains, canyons, and valleys. Through sampling, they look at millions of years of history of sea-floor spreading, plate tectonics, and oceanic circulation and climates. They also examine volcanic processes, mantle circulation, hydrothermal circulation, magma genesis, and crustal formation. The results of their work help us understand the processes that created the ocean basins and the interactions between the ocean and the seafloor.
- Physical oceanographers study the physical conditions and physical processes within the ocean such as waves, currents, eddies, gyres and tides; the transport of sand on and off beaches; coastal erosion; and the interactions of the atmosphere and the ocean. They examine deep currents, the ocean-atmosphere relationship that influences weather and climate, the transmission of light and sound through water, and the ocean's interactions with its boundaries at the seafloor and the coast.
- Standalone Lesson (no technology required)
- Internet Required
- One-to-a-Group
- Teacher computer/projector only

