color earth system icon
Just one moment,
loading Earth as a System...

Featured Mini Lessons

Grade Level: 6-8

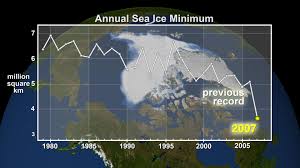
Arctic sea ice is the cap of frozen seawater blanketing most of the Arctic Ocean and neighboring seas in wintertime. It follows seasonal patterns of thickening and melting. Students view how the quantity has changed from 1979 through 2018. 

Grade Level: 6-8

This mini lesson has students explore three visualizations to see the new benchmark map scientists can use to study the extent and speed of changes to the largest ice sheet in the world.

Grade Level: 6-8, 9-12

Explore using units for calculations with Normalized Difference Vegetation Index (NDVI). NDVI is a ratio of different light wavelength reflectance which can be used to map the density of green vegetation.

Grade Level: 6-8, 9-12

Explore using units in calculations with the Leaf Area Index (LAI). LAI is a ratio that describes the number of square meters of leaves per square meter of available land surface. Because of the units in the ratio, it is dimensionless.

Grade Level: 6-8, 9-12

The fires in Greece during the summer of 2007 devastated large tracks of forest and ground cover in this Mediterranean region. Students analyze these data to determine the scale, area, and percentage of the forest impacted by of these fires.

google slides icon
Grade Level: 6-8

The Eyjabakkajökull Glacier is an outlet glacier of the Vatnajökull ice cap in Iceland that has been retreating since a major surge occurred in 1973. Students analyze these maps to identify the scale and rate of change of the glacier loss.

Grade Level: 3-5, 6-8

Learn about the different cloud types and their names. Match cloud photos and names by cloud type and for all types. Evaluate the types of clouds represented in various data displays.

Grade Level: 6-8, 9-12

Students learn how to estimate the "energy efficiency" of photosynthesis, or the amount of energy that plants absorb for any given location on Earth.

Grade Level: 3-5, 6-8

Students will analyze a pie chart (circle graph) showing the distribution of different parts of the Earth system's absorption and reflection of energy.