Grade Level: 6-8
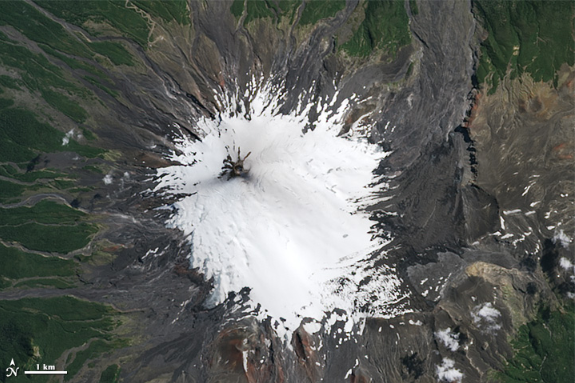
Students use scale to determine the area of volcanic deposits following the March 3, 2015 eruption of Chile's Mount Villarrica stratovolcano, one of the country's most active volcanoes.
The Earth's system is characterized by the interaction of processes that take place on molecular (very small) and planetary (very large) spatial scales, as well as on short and long time scales. Before scientists may begin their work with these data, it is important that they understand what the data are.

Students use scale to determine the area of volcanic deposits following the March 3, 2015 eruption of Chile's Mount Villarrica stratovolcano, one of the country's most active volcanoes.
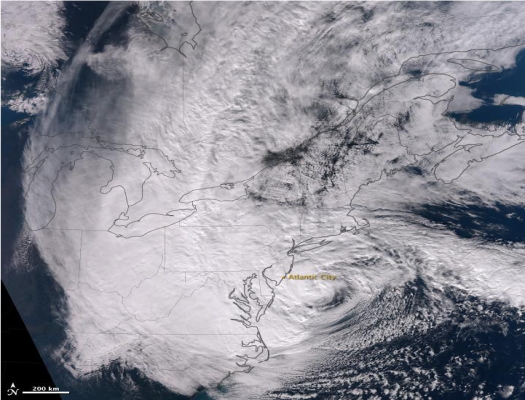

Students investigate the effects of Hurricane Sandy and make a scale model of the storm over the continental United States to assess the area of impact.
In this activity, students use satellite images from the NASA Landsat team to quantify changes in glacier cover over time from 1986 to 2018.

Students will analyze and interpret maps of the average net atmospheric radiation to compare the flow of energy from the Sun toward Earth in different months and for cloudy versus clear days. Students will draw conclusions and support them with evidence.

Students will engage in a “Zoom In Inquiry” learning routine to understand the symbols on a world map that shows population-weighted concentrations of PM2.5. They will reflect on how their perception of the image changed as they saw more of the image.

Students will engage in a “Zoom In Inquiry” learning routine to understand a world map that shows changes in PM2.5-attributable mortality per 100,000 population (Bondie, 2013).
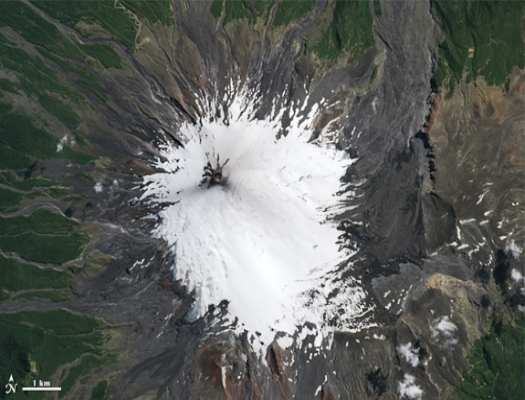
Students use scale to determine the area of volcanic deposits following the March 3, 2015 eruption of Chile's Mount Villarrica stratovolcano, one of the country's most active volcanoes.
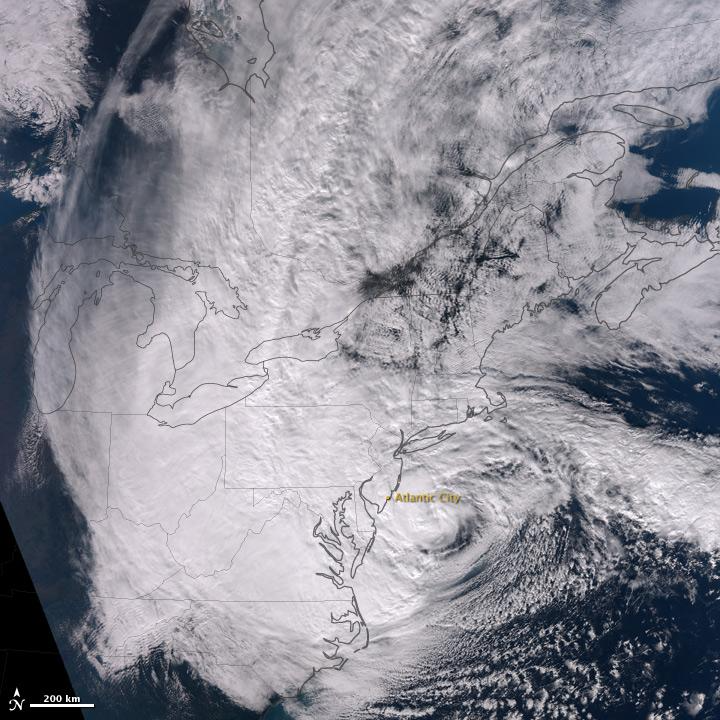
Students investigate the effects of Hurricane Sandy and make a scale model of the storm over the continental United States to assess the area of impact.
In this activity, students use satellite images from the NASA Landsat team to quantify changes in glacier cover over time from 1986 to 2018.
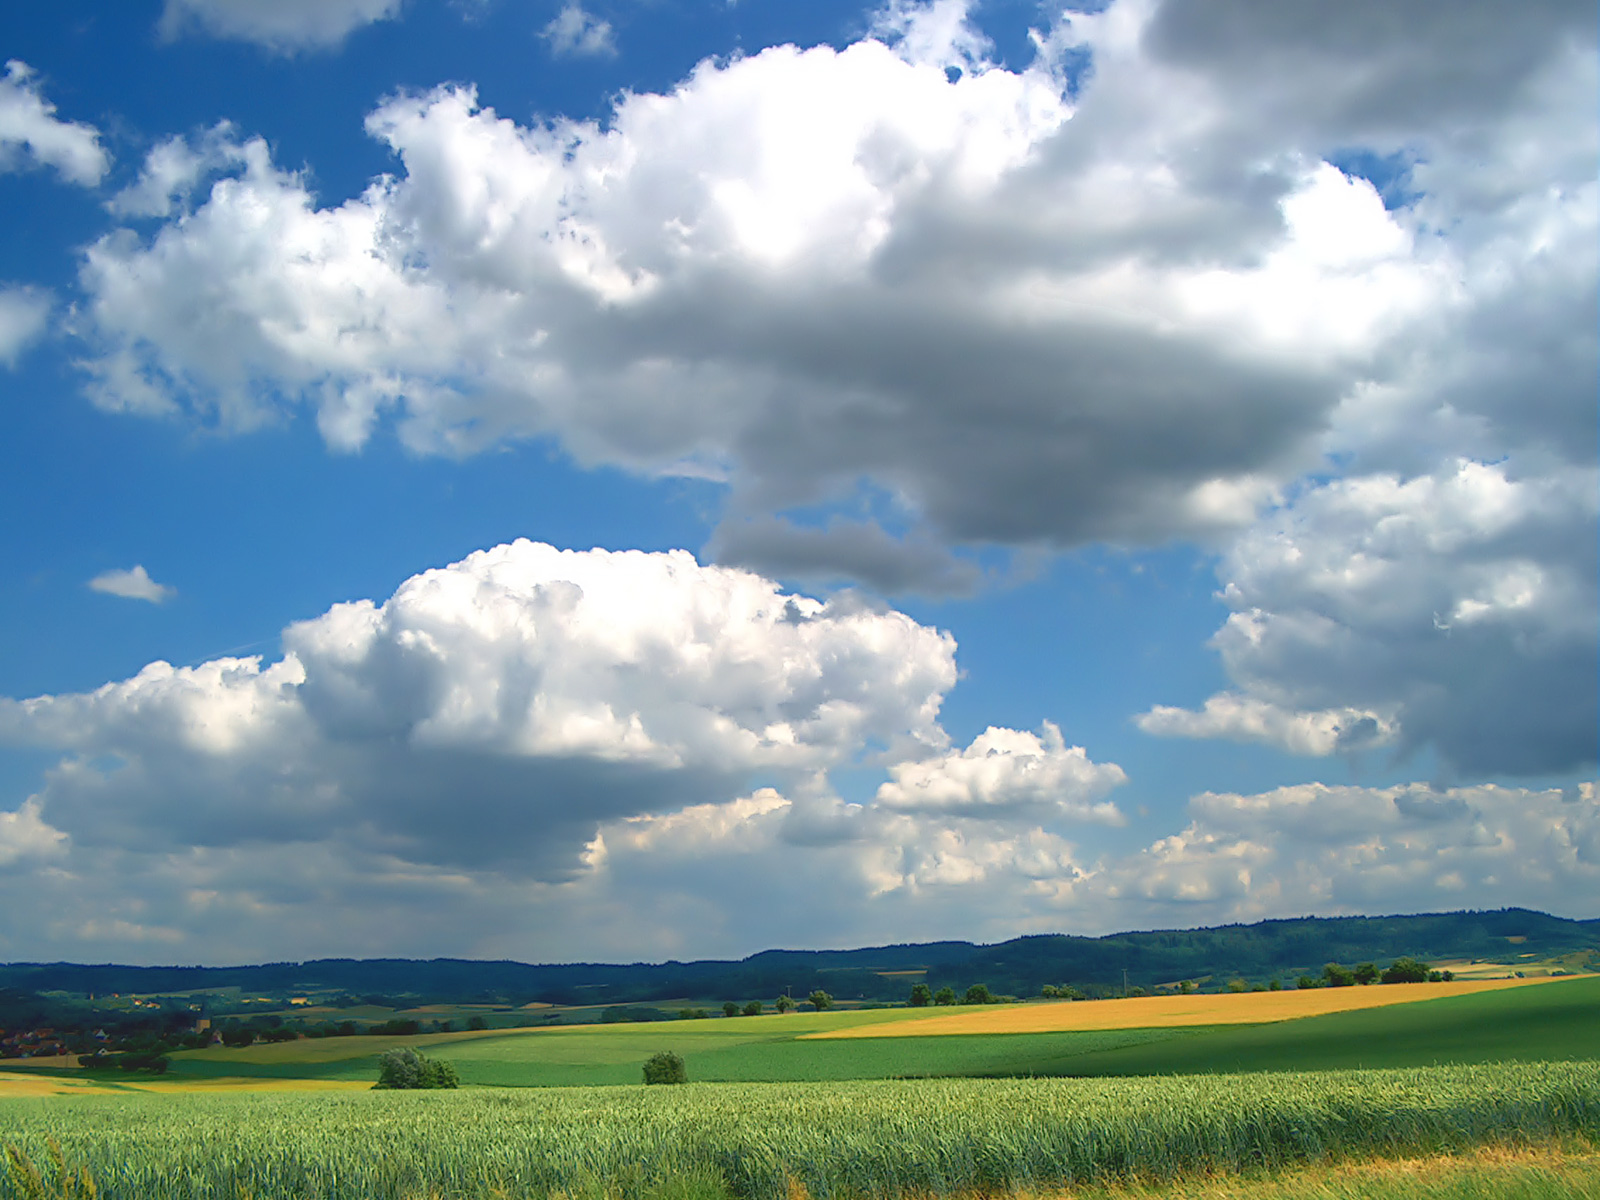
Students will analyze and interpret maps of the average net atmospheric radiation to compare the flow of energy from the Sun toward Earth in different months and for cloudy versus clear days. Students will draw conclusions and support them with evidence.
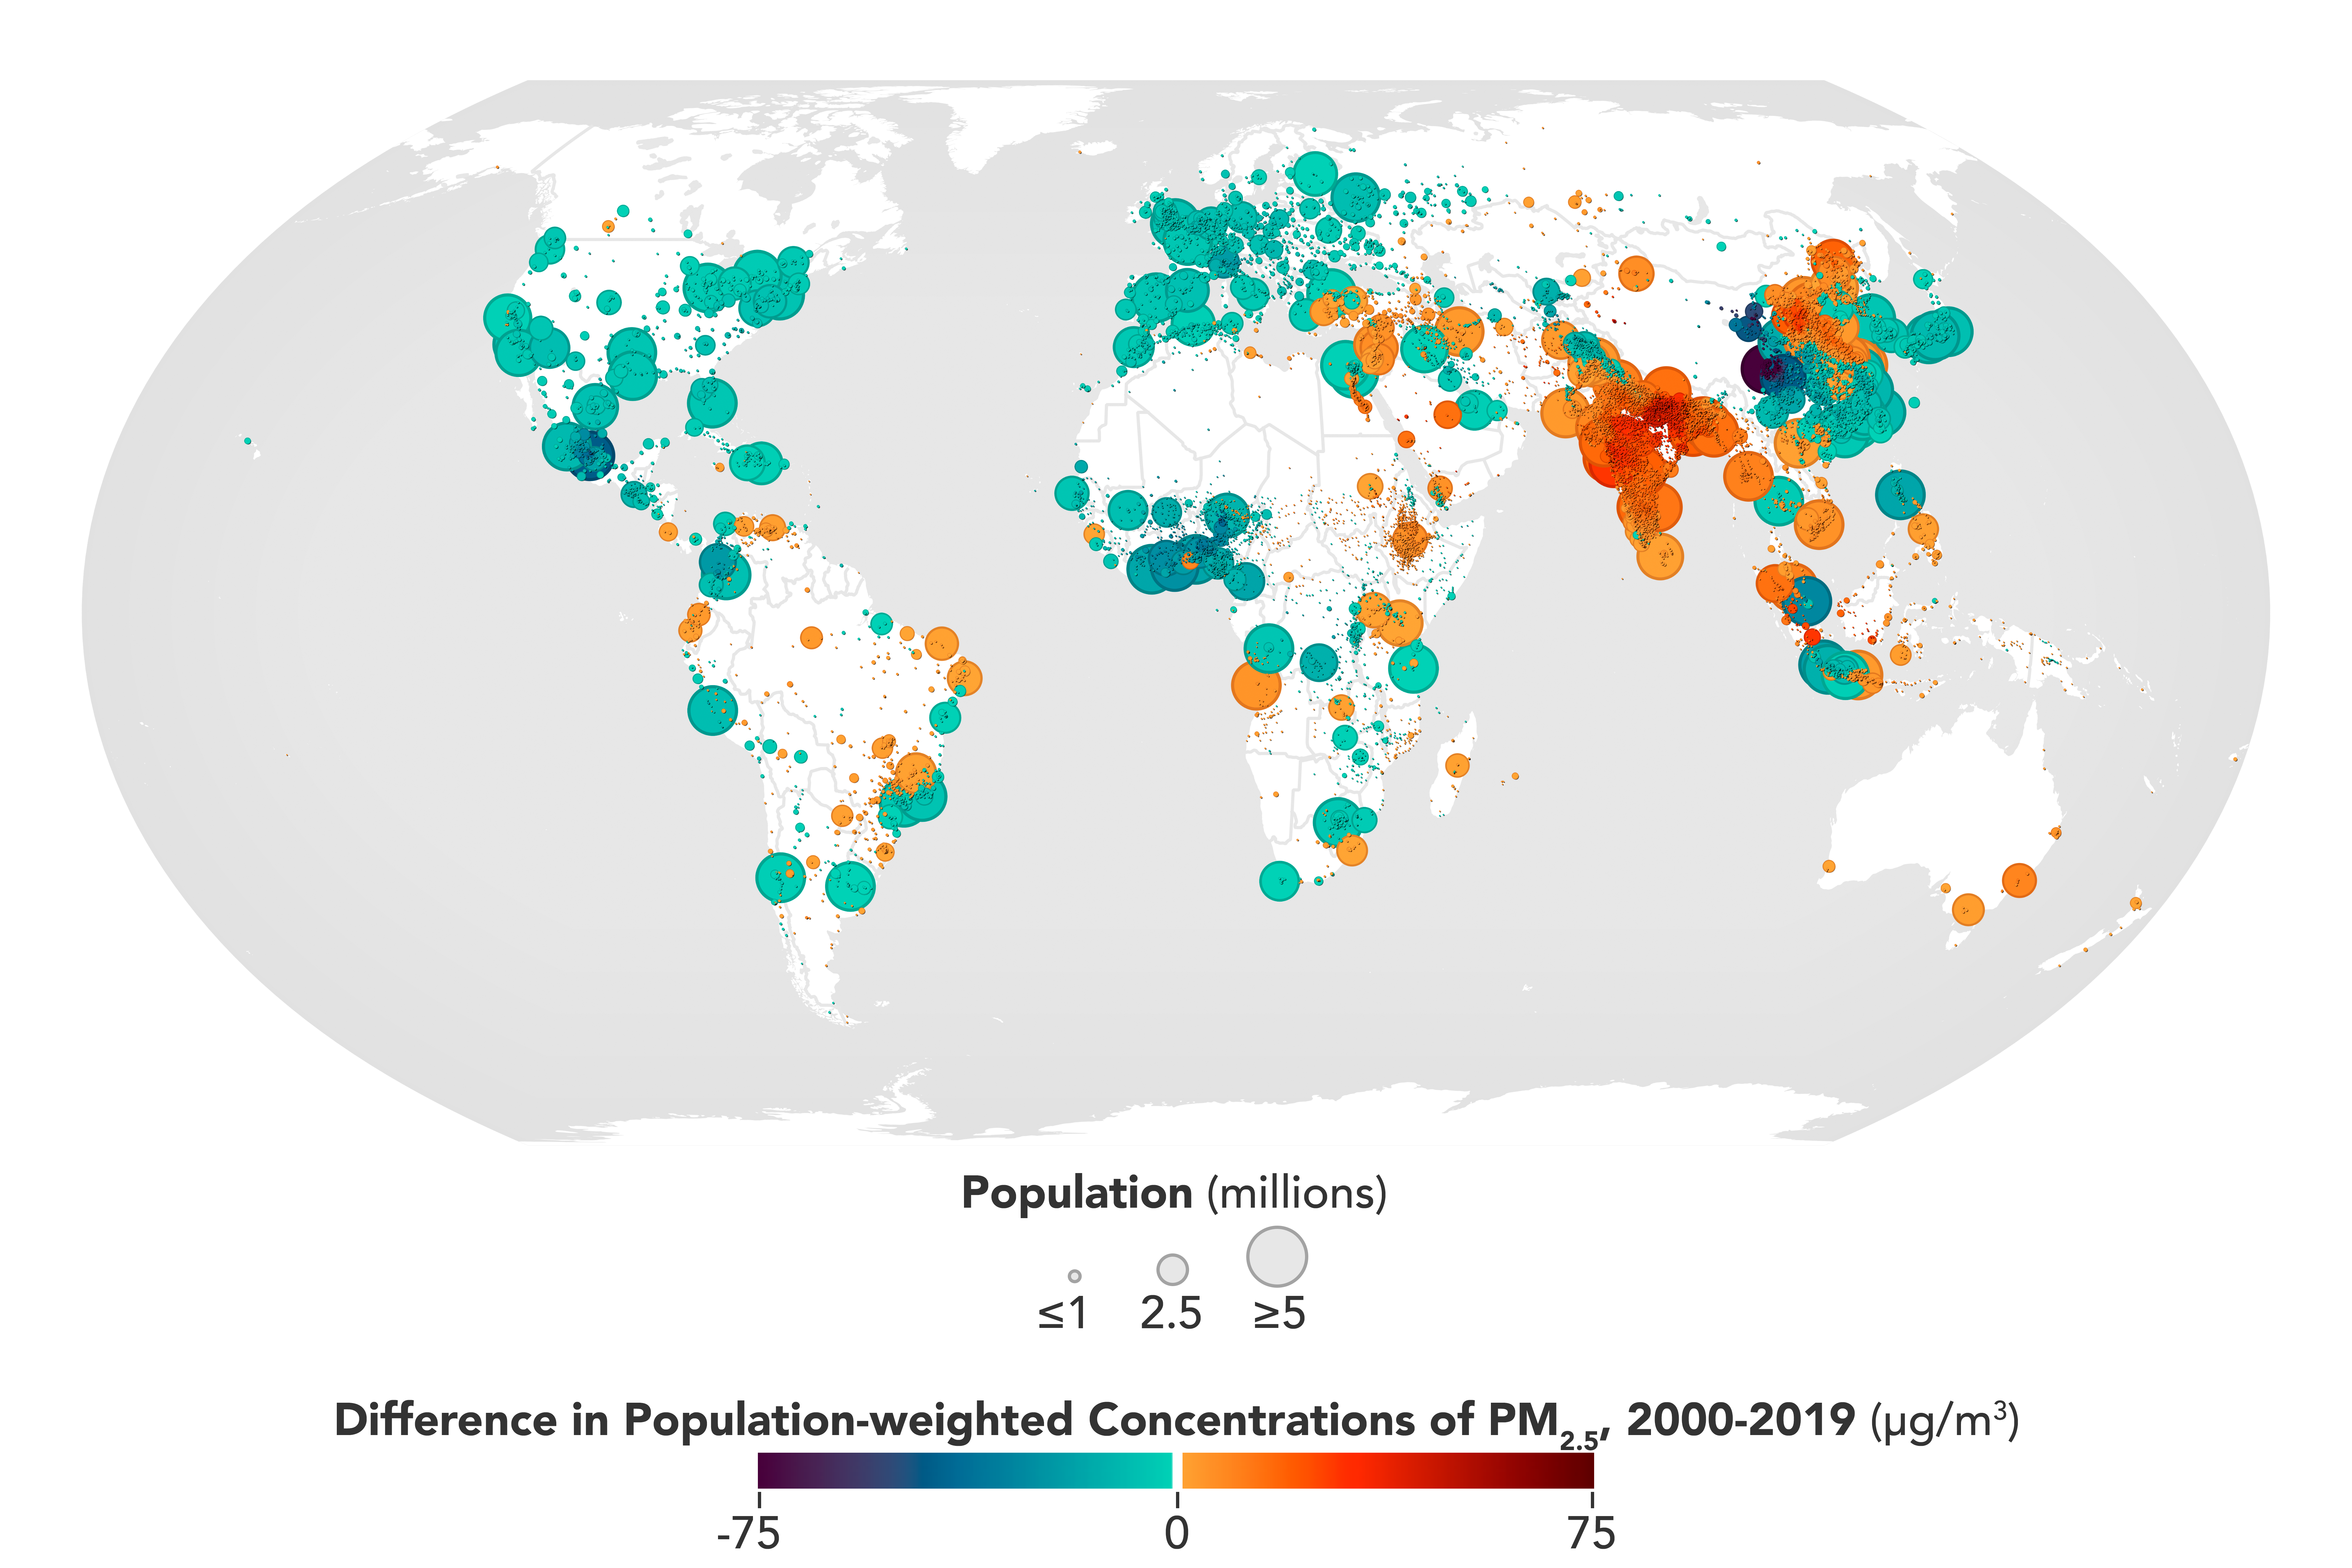
Students will engage in a “Zoom In Inquiry” learning routine to understand the symbols on a world map that shows population-weighted concentrations of PM2.5. They will reflect on how their perception of the image changed as they saw more of the image.
Students will engage in a “Zoom In Inquiry” learning routine to understand a world map that shows changes in PM2.5-attributable mortality per 100,000 population (Bondie, 2013).