Students use scale to determine the area of volcanic deposits following the March 3, 2015 eruption of Chile's Mount Villarrica stratovolcano, one of the country's most active volcanoes.
Materials Required
Rulers
Colored printouts of images
Procedure
Introduce the Event:
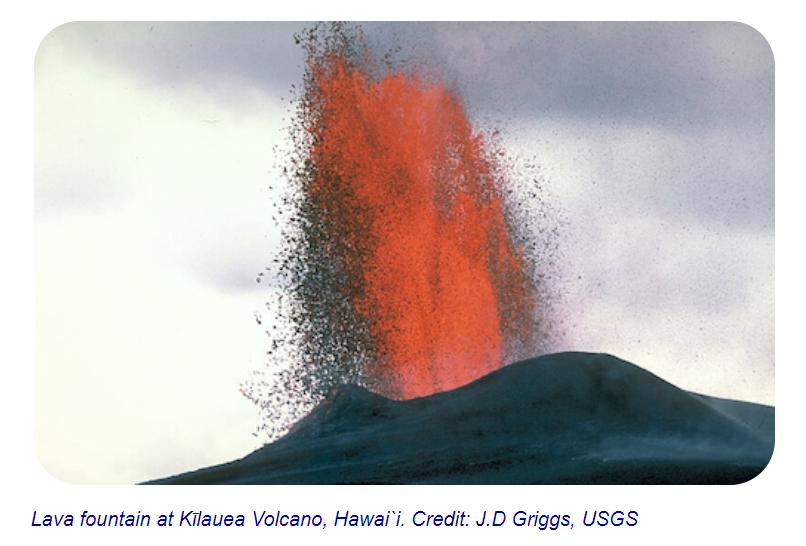
Show students the two pictures of Mount Villarrica. Do not tell them what they are. Have them make observations about the pictures and note similarities and differences.
Work Collaboratively: Think-Pair-Share
Have students discuss and share with each other what they think happened in the picture.
After students share their ideas, provide the context for the pictures.
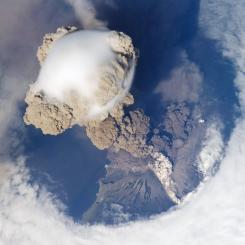
In the predawn hours of March 3, 2015, one of Chile’s most active volcanoes exploded to life. Thousands of people evacuated from within a 10-kilometer (6-mile) radius of Villarrica.
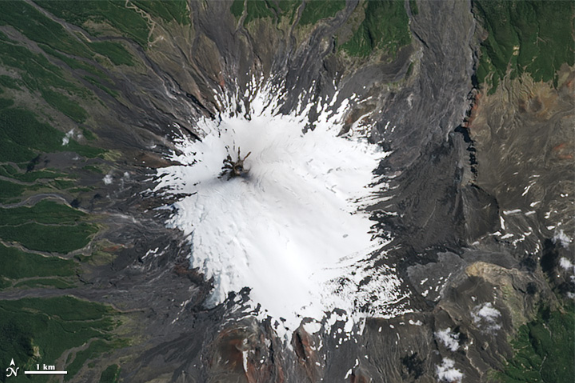
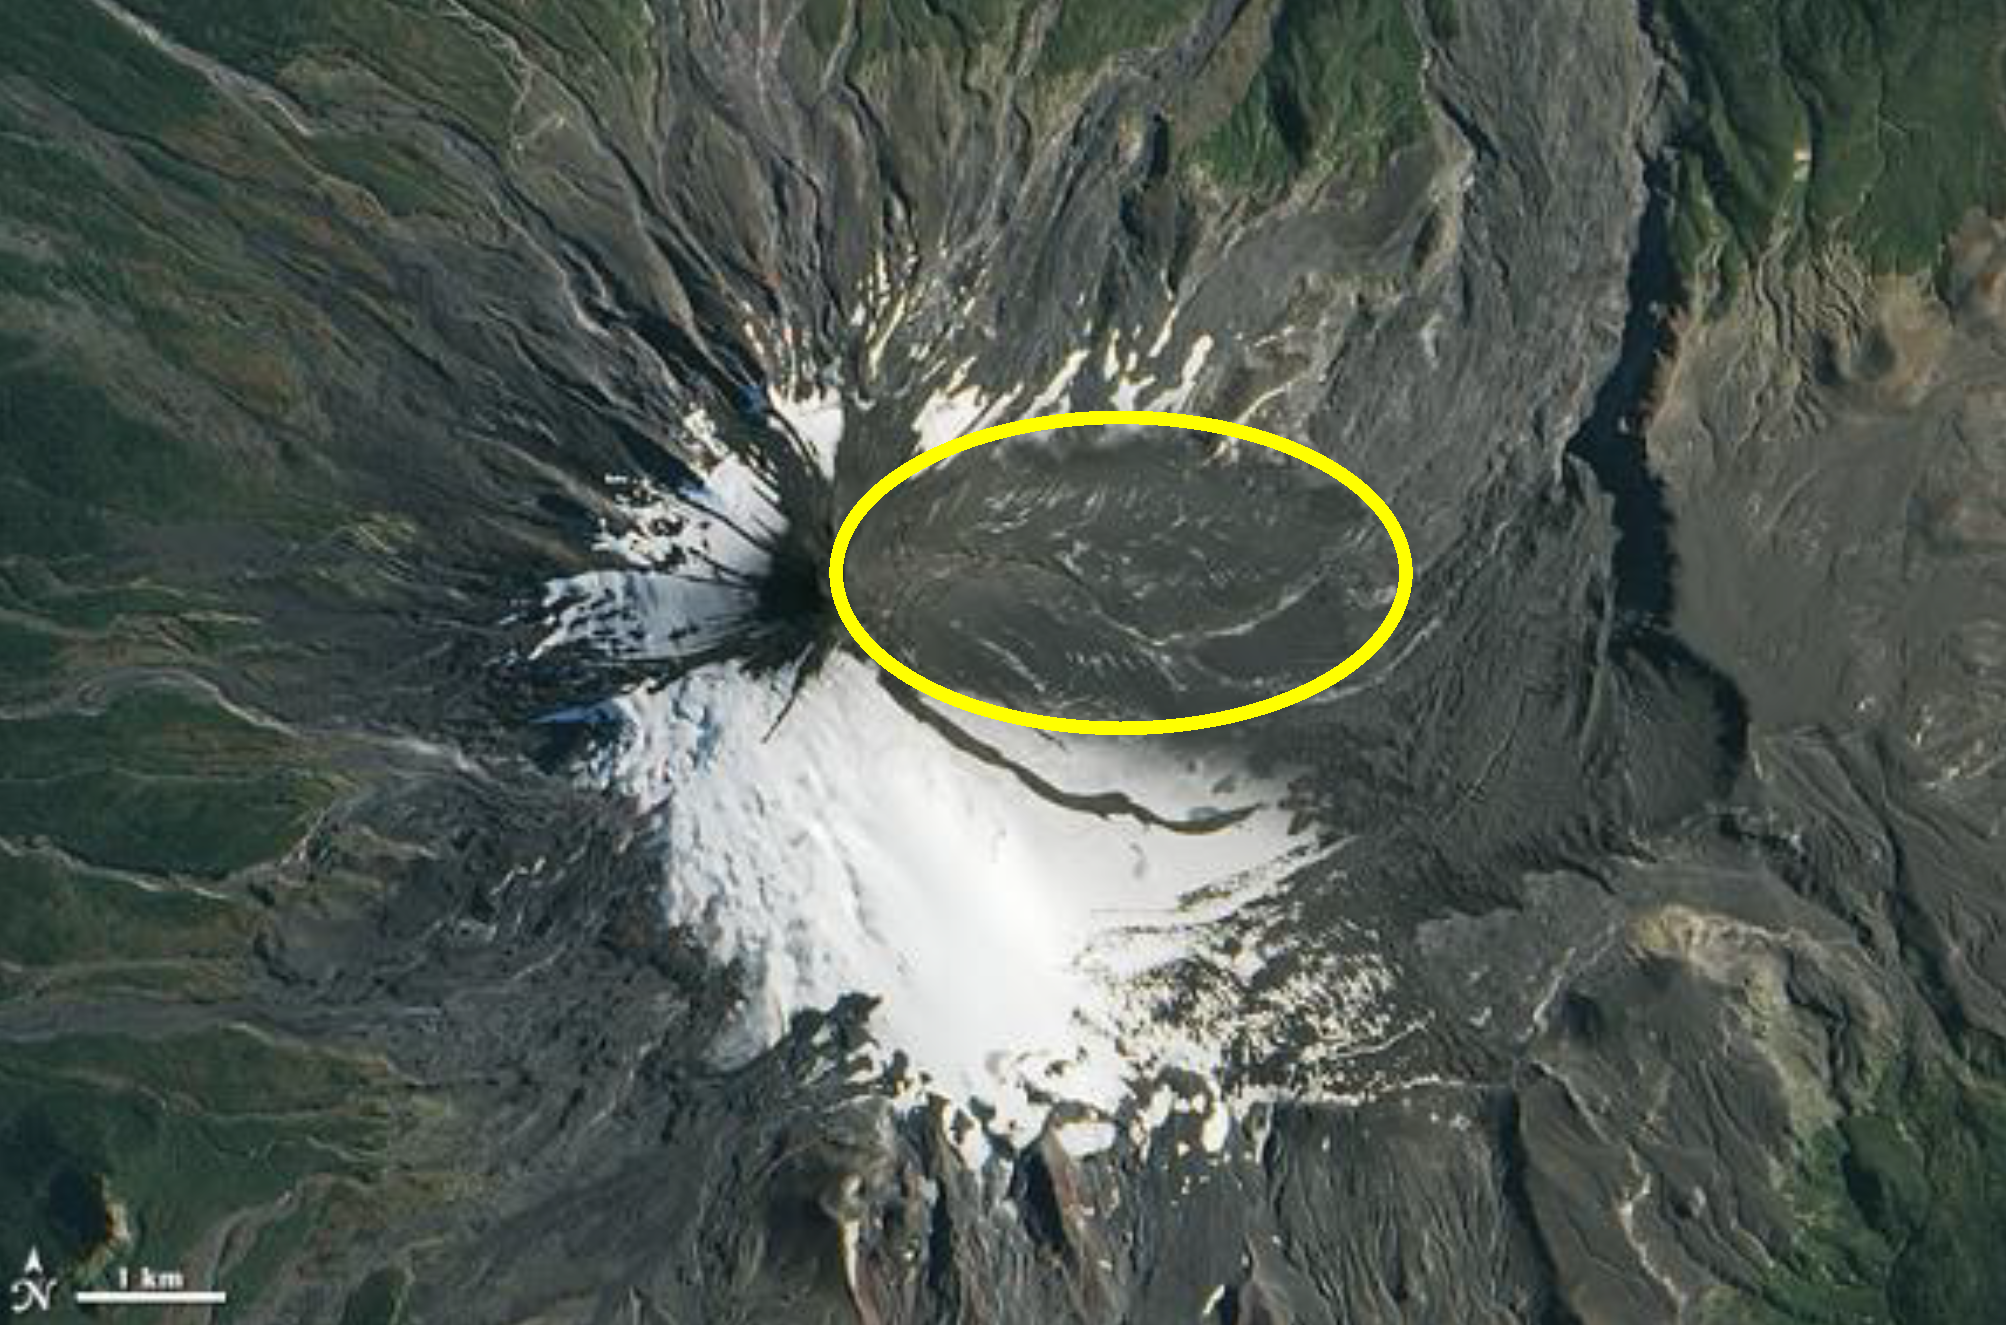
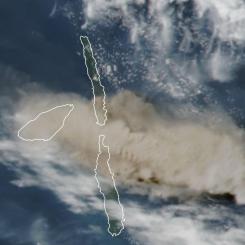
Villarrica Volcano February 22, 2015- Image NASA Earth Observatory
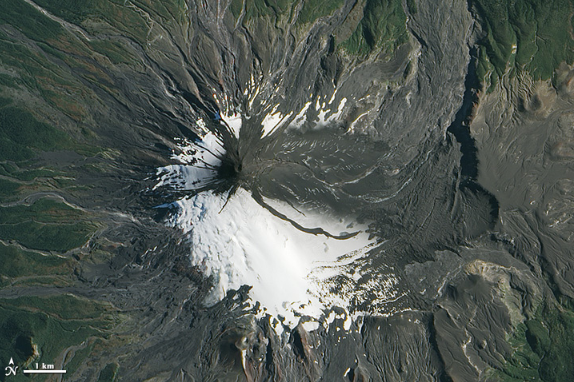
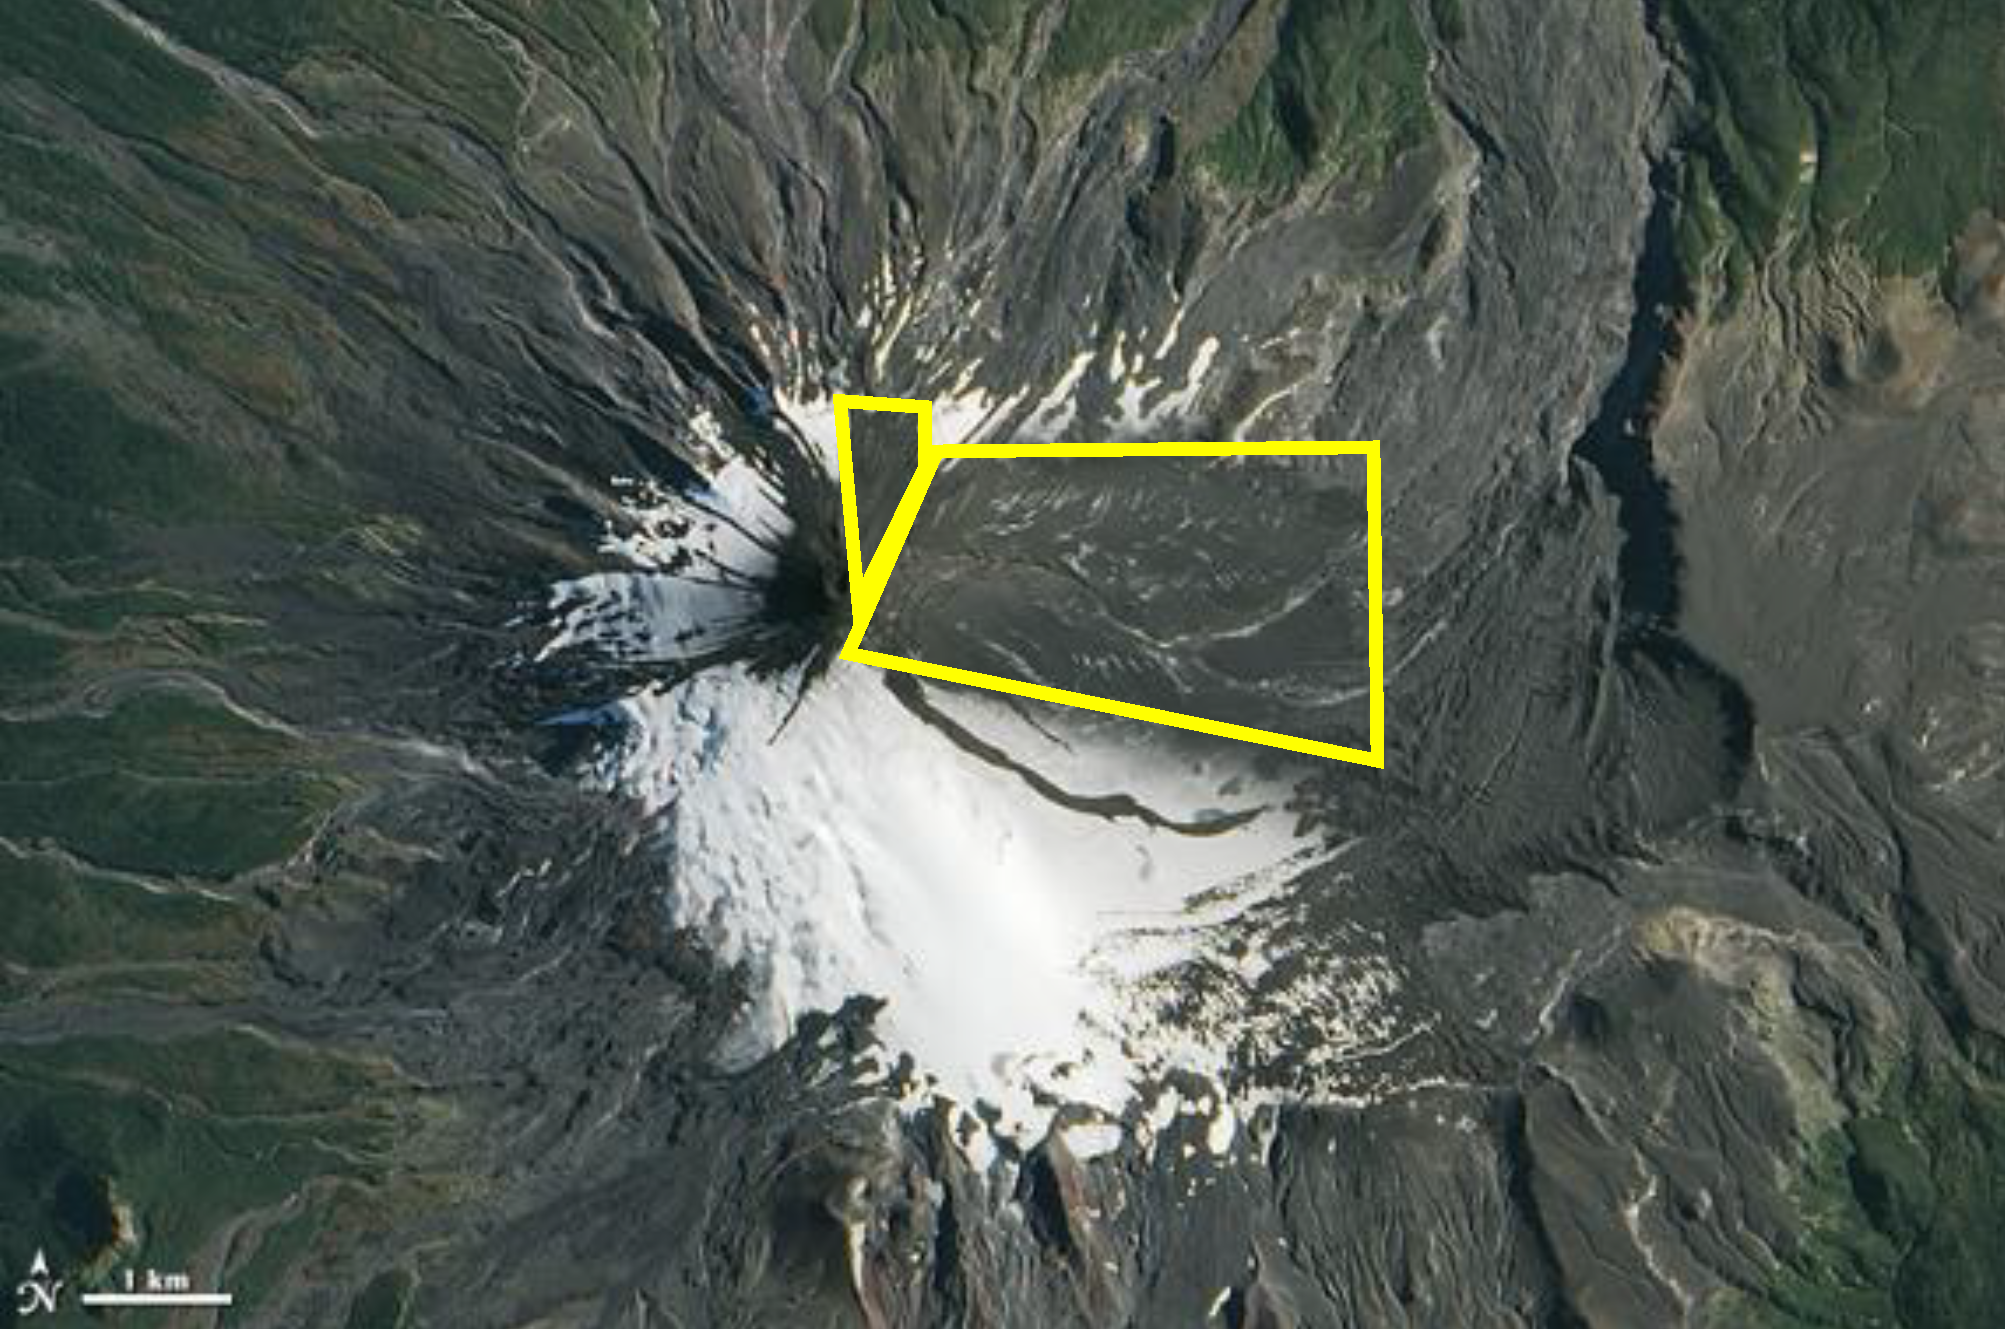
The Operational Land Imager (OLI) on Landsat 8 acquired the top image on February 22, 2015, prior to the main eruption. The Advanced Land Imager (ALI) on the EO-1 satellite captured the second image on March 5. A large volume of volcanic material ejected during the eruption is apparent on the mountain’s eastern side.
Activity at Villarrica had been increasing through much of February, made evident by a rise in seismicity, crater incandescence, and explosions, according to reports from Chile’s National Geology and Mining Service (SERNAGEOMIN) (posted in English by the Smithsonian Institution’s Global Volcanism Program). A faint layer of ash is apparent on the volcano’s flanks.
Just prior to the March 3 eruption, geophysicist Jeffrey Johnson and his family prepared to evacuate their home in Pucón, Chile, about 17 kilometers (11 miles) northwest of the volcano. However, the eruption slowed after just 30 minutes. Johnson watched the fire fountain subside and then resumed his work analyzing low-frequency sounds captured by dozens of microphones placed on and near the mountain.
NASA Earth Observatory images by Jesse Allen, using EO-1 ALI data provided courtesy of the NASA EO-1 team and Landsat data from the U.S. Geological Survey. Caption by Kathryn Hansen.
Villarrica Volcano March 5, 2015- Image Credit NASA Earth Observatory
Determine the Affected Area:
Students may work in small groups or individually to calculate the area covered by volcanic debris.
Direct students to focus on the March 5, 2015 image.
Ask students to estimate the area of the new volcanic deposits.
Measure the length on the image scale that is equal to 1 km. Call the measurement S.
Have students write the scale S cm = 1 km.
Draw a rectangle around the area debris that was deposited. It will not fit exactly but should be their best estimate.
Sample rectangle for area calculationSample calculation for length using scale
Measure the length and width of the rectangle.
Use the scale on the image to calculate the area of the debris in square kilometers.
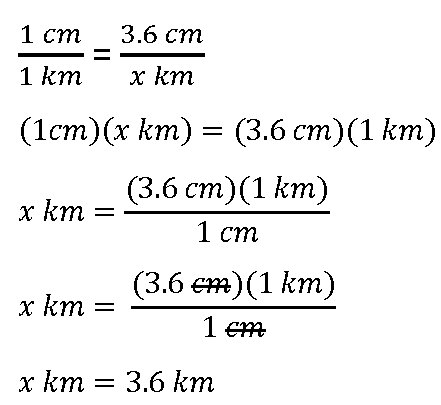
Example (For illustration purposes only. Assume the scale is 1 cm = 1 km and the length and width are the measurements below.):
Length = 3.2 cm
Width = 1.6 cm
Calculate the length as follows.
Calculate the width the same way.
Calculate the area of the area by multiplying the length by the width. Remember to use the correct units.
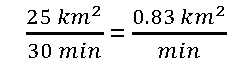
The eruption lasted approximately 30 minutes. Calculate the rate of deposition by dividing the area by the time.
Example (For illustration purposes only. Assume the area is 25 km2):
Sample rate calculation.
Exit Ticket
Based upon the calculations, what would be a safe distance from the volcano if there were an hour long eruption of the same force? Explain.
Glacier-clad Villarrica is one of Chile's most active volcanoes. It rises above the lake and town of the same name. It is the westernmost of three large stratovolcanoes that trend perpendicular to the Andean chain. A 6-km-wide caldera formed during the late Pleistocene. A 2-km-wide caldera that formed about 3500 years ago is located at the base of the presently active, dominantly basaltic to basaltic-andesitic cone at the NW margin of the Pleistocene caldera. Historical eruptions, documented since 1558, have consisted largely of mild-to-moderate explosive activity with occasional lava effusion.
Launched on February 11, 2013, Landsat 8 (formerly the Landsat Data Continuity Mission, LDCM) is the most recently launched Landsat satellite. It is collecting valuable data and imagery used in agriculture, education, business, science, and government.
The Landsat Program provides repetitive acquisition of high resolution multispectral data of the Earth’s surface on a global basis. The data from Landsat spacecraft constitute the longest record of the Earth’s continental surfaces as seen from space. It is a record unmatched in quality, detail, coverage, and value.
Geotechnical Engineer - A geotechnical engineer is a type of civil engineer who focuses on the mechanics of the land, rocks, and soils in the building process. This type of engineering includes, but is not limited to, analyzing, designing, and constructing foundations, retaining structures, slopes, embankments, roadways, tunnels, levees, wharves, landfills, and other systems that are comprised of rock or soil.
Data Visualizer - At the core of scientific visualization is the representation of data graphically - through images, animations, and videos - to improve understanding and develop insight. Data visualizers develop data-driven images, maps, and visualizations from information collected by Earth-observing satellites, airborne missions, and ground measurements. Visualizations allow us to explore data, phenomena and behavior; they are particularly effective for showing large scales of time and space, and "invisible" processes (e.g. flows of energy and matter) as integral parts of the models.
Remote Sensing Specialist - Remote sensing scientists use sensors to analyze data and solve regional, national and global concerns. For instance, natural resource management, urban planning, and climate and weather prediction are applications of remote sensing. Many scientists develop new sensor systems, analytical techniques, or new applications for existing systems. They also work to develop and build databases for remote sensing or geospatial; meaning relating to or denoting data that is associated with a particular location, project information. Remote sensing scientists also process aerial or satellite imagery to create products like land cover maps.
Students use scale to determine the area of volcanic deposits following the March 3, 2015 eruption of Chile's Mount Villarrica stratovolcano, one of the country's most active volcanoes.