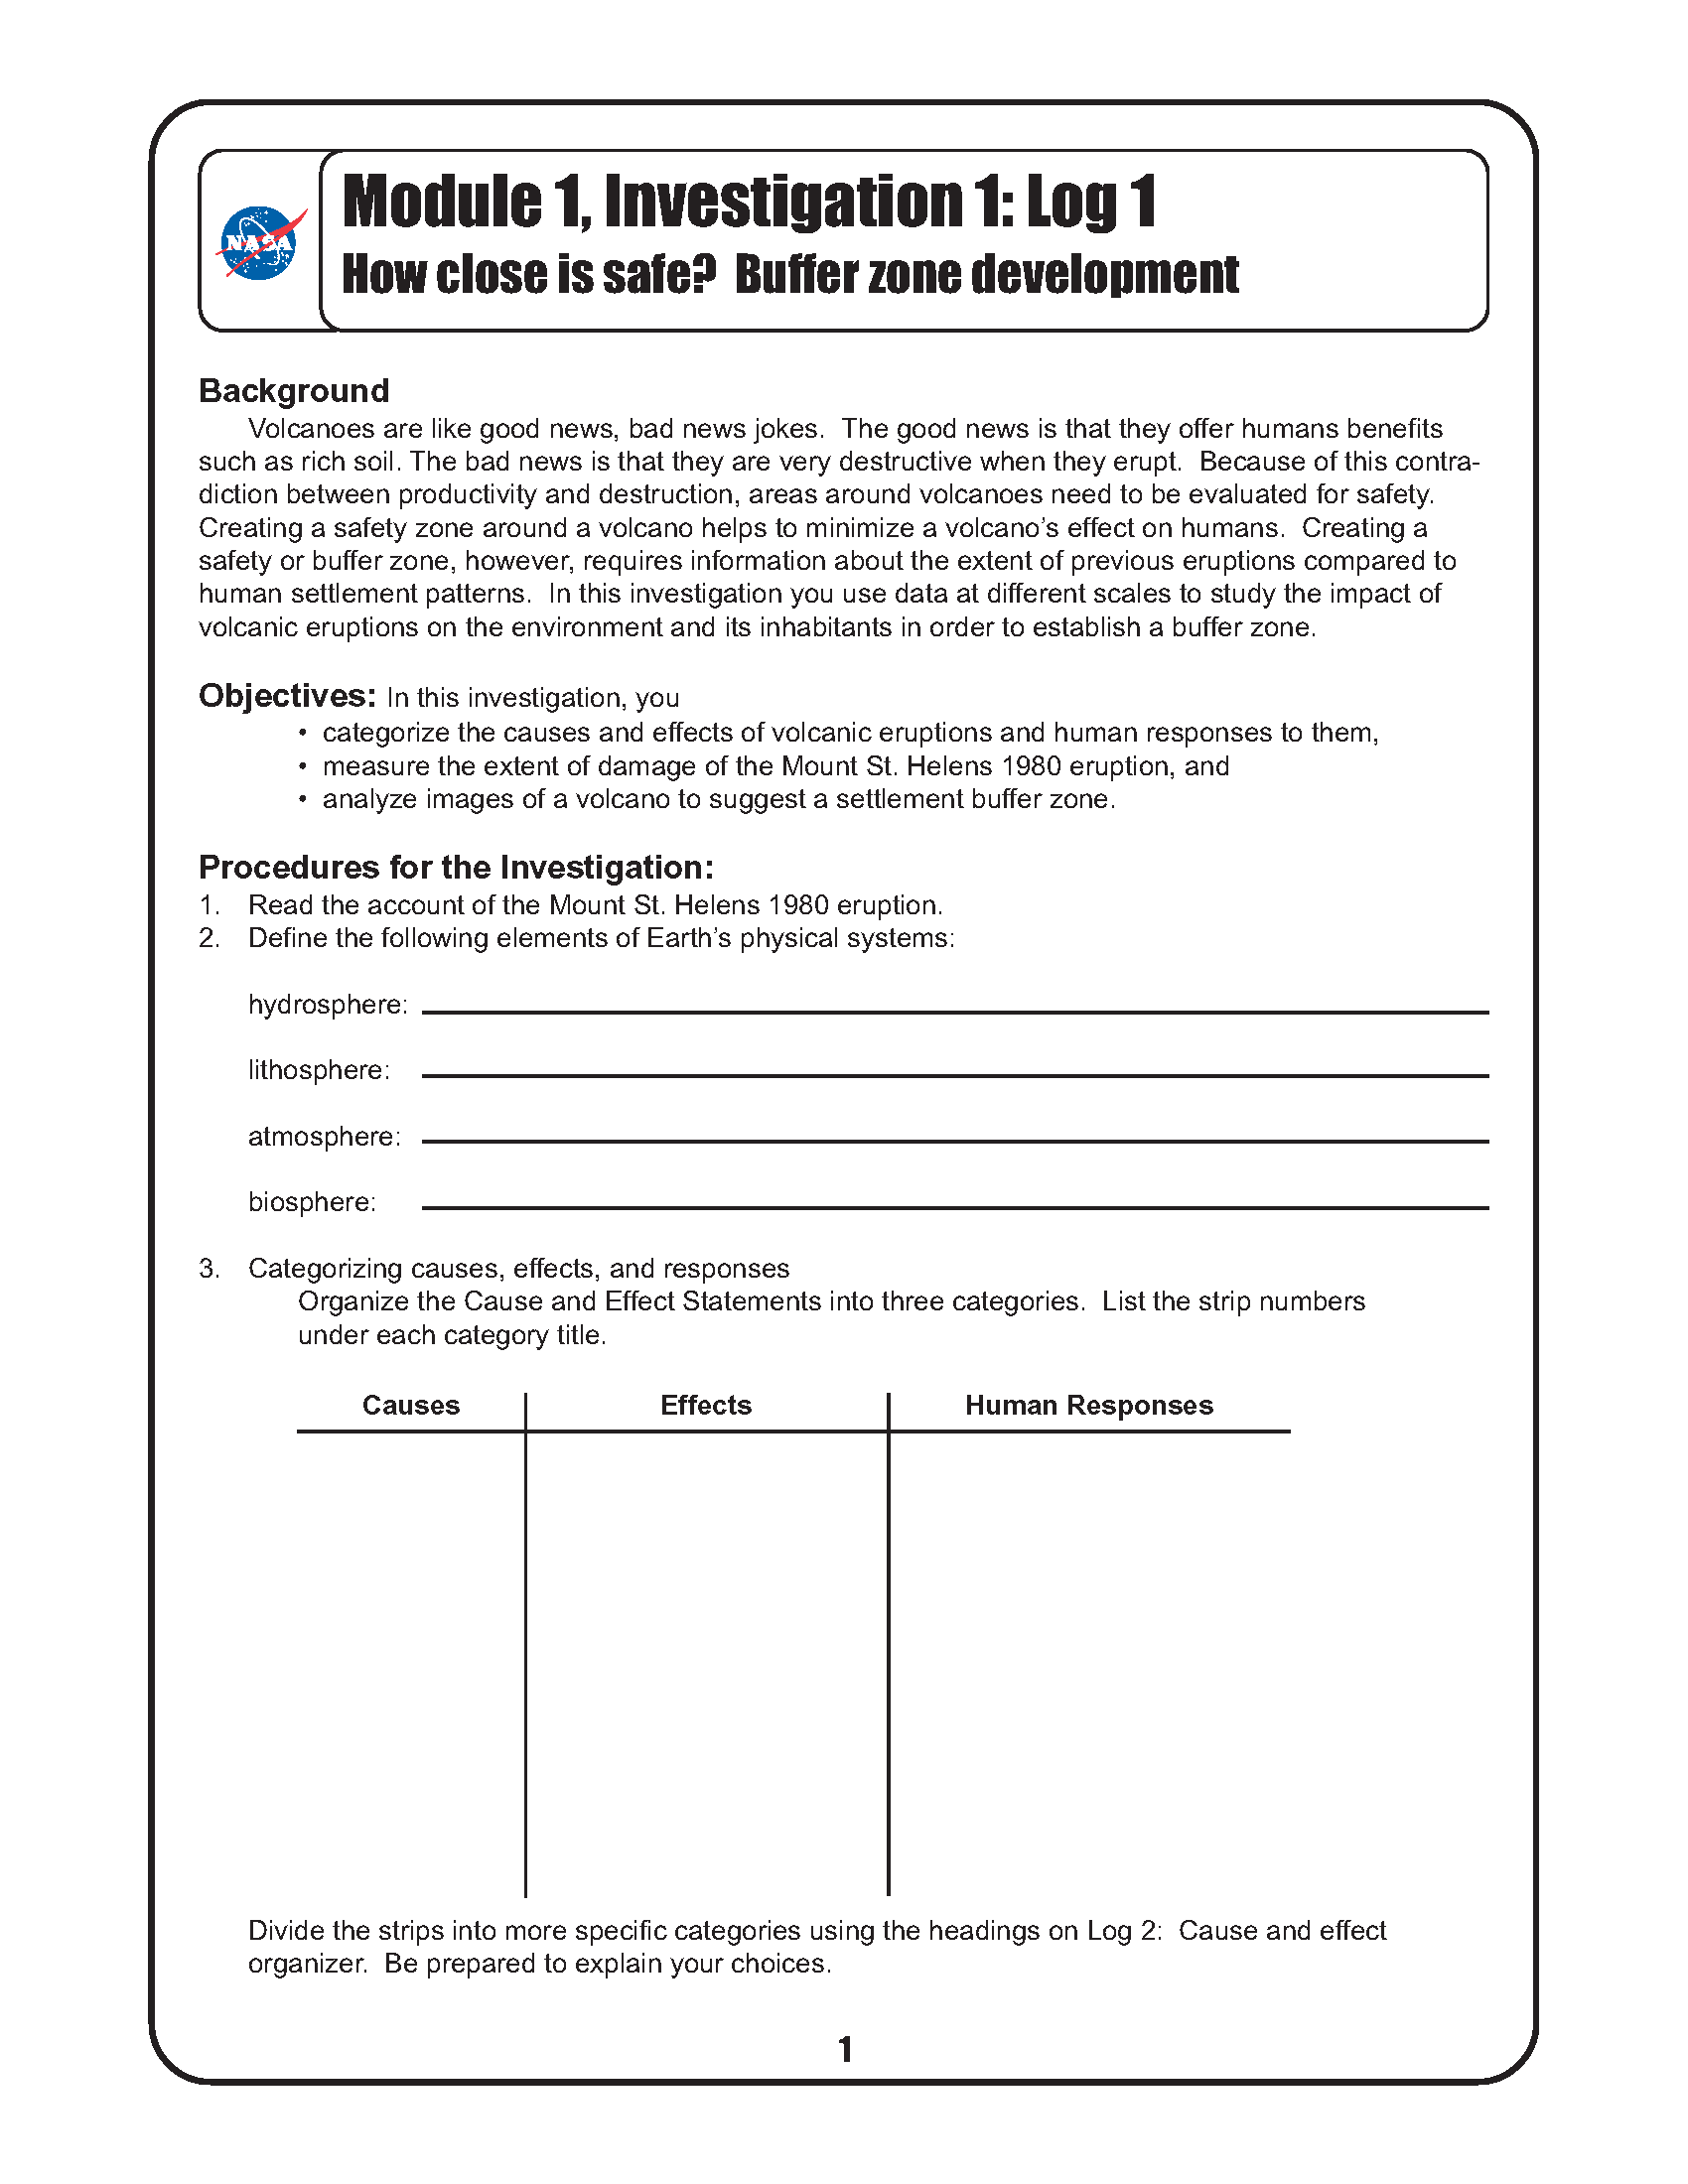
Lesson Plans
Mount Saint Helens Volcano
Overview
This investigation provides an overview of the local effects of volcanism. Students categorize causes, effects, and responses to volcanic hazards by focusing on the interdependence of all Earth systems. Using various remotely-sensed images, students observe the visible effects of the eruption of Mount St. Helens in 1980 over time. Based on these observations, students identify a buffer zone to designate safer locations for development.
This lesson has been adapted from the NASA Mission Geography module; most of the content is the same.
“How Close Is Safe: Buffer Zone Development.” Mission Geography, Mission Geography/NASA.
Materials Required
All master copies can be found in the Student Sheets Document
- Log 1, Briefing, and Log 2 (one copy per student)
- One set of Cause and Effect Statements, cut into strips (per group)
- Poster paper for categorization (per group)
- Student Sheets Images (one copy per group)
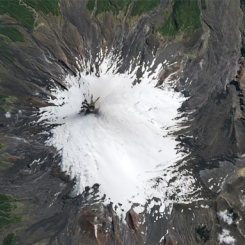
- Figure 1: Mount St. Helens, March 1980, before the eruption
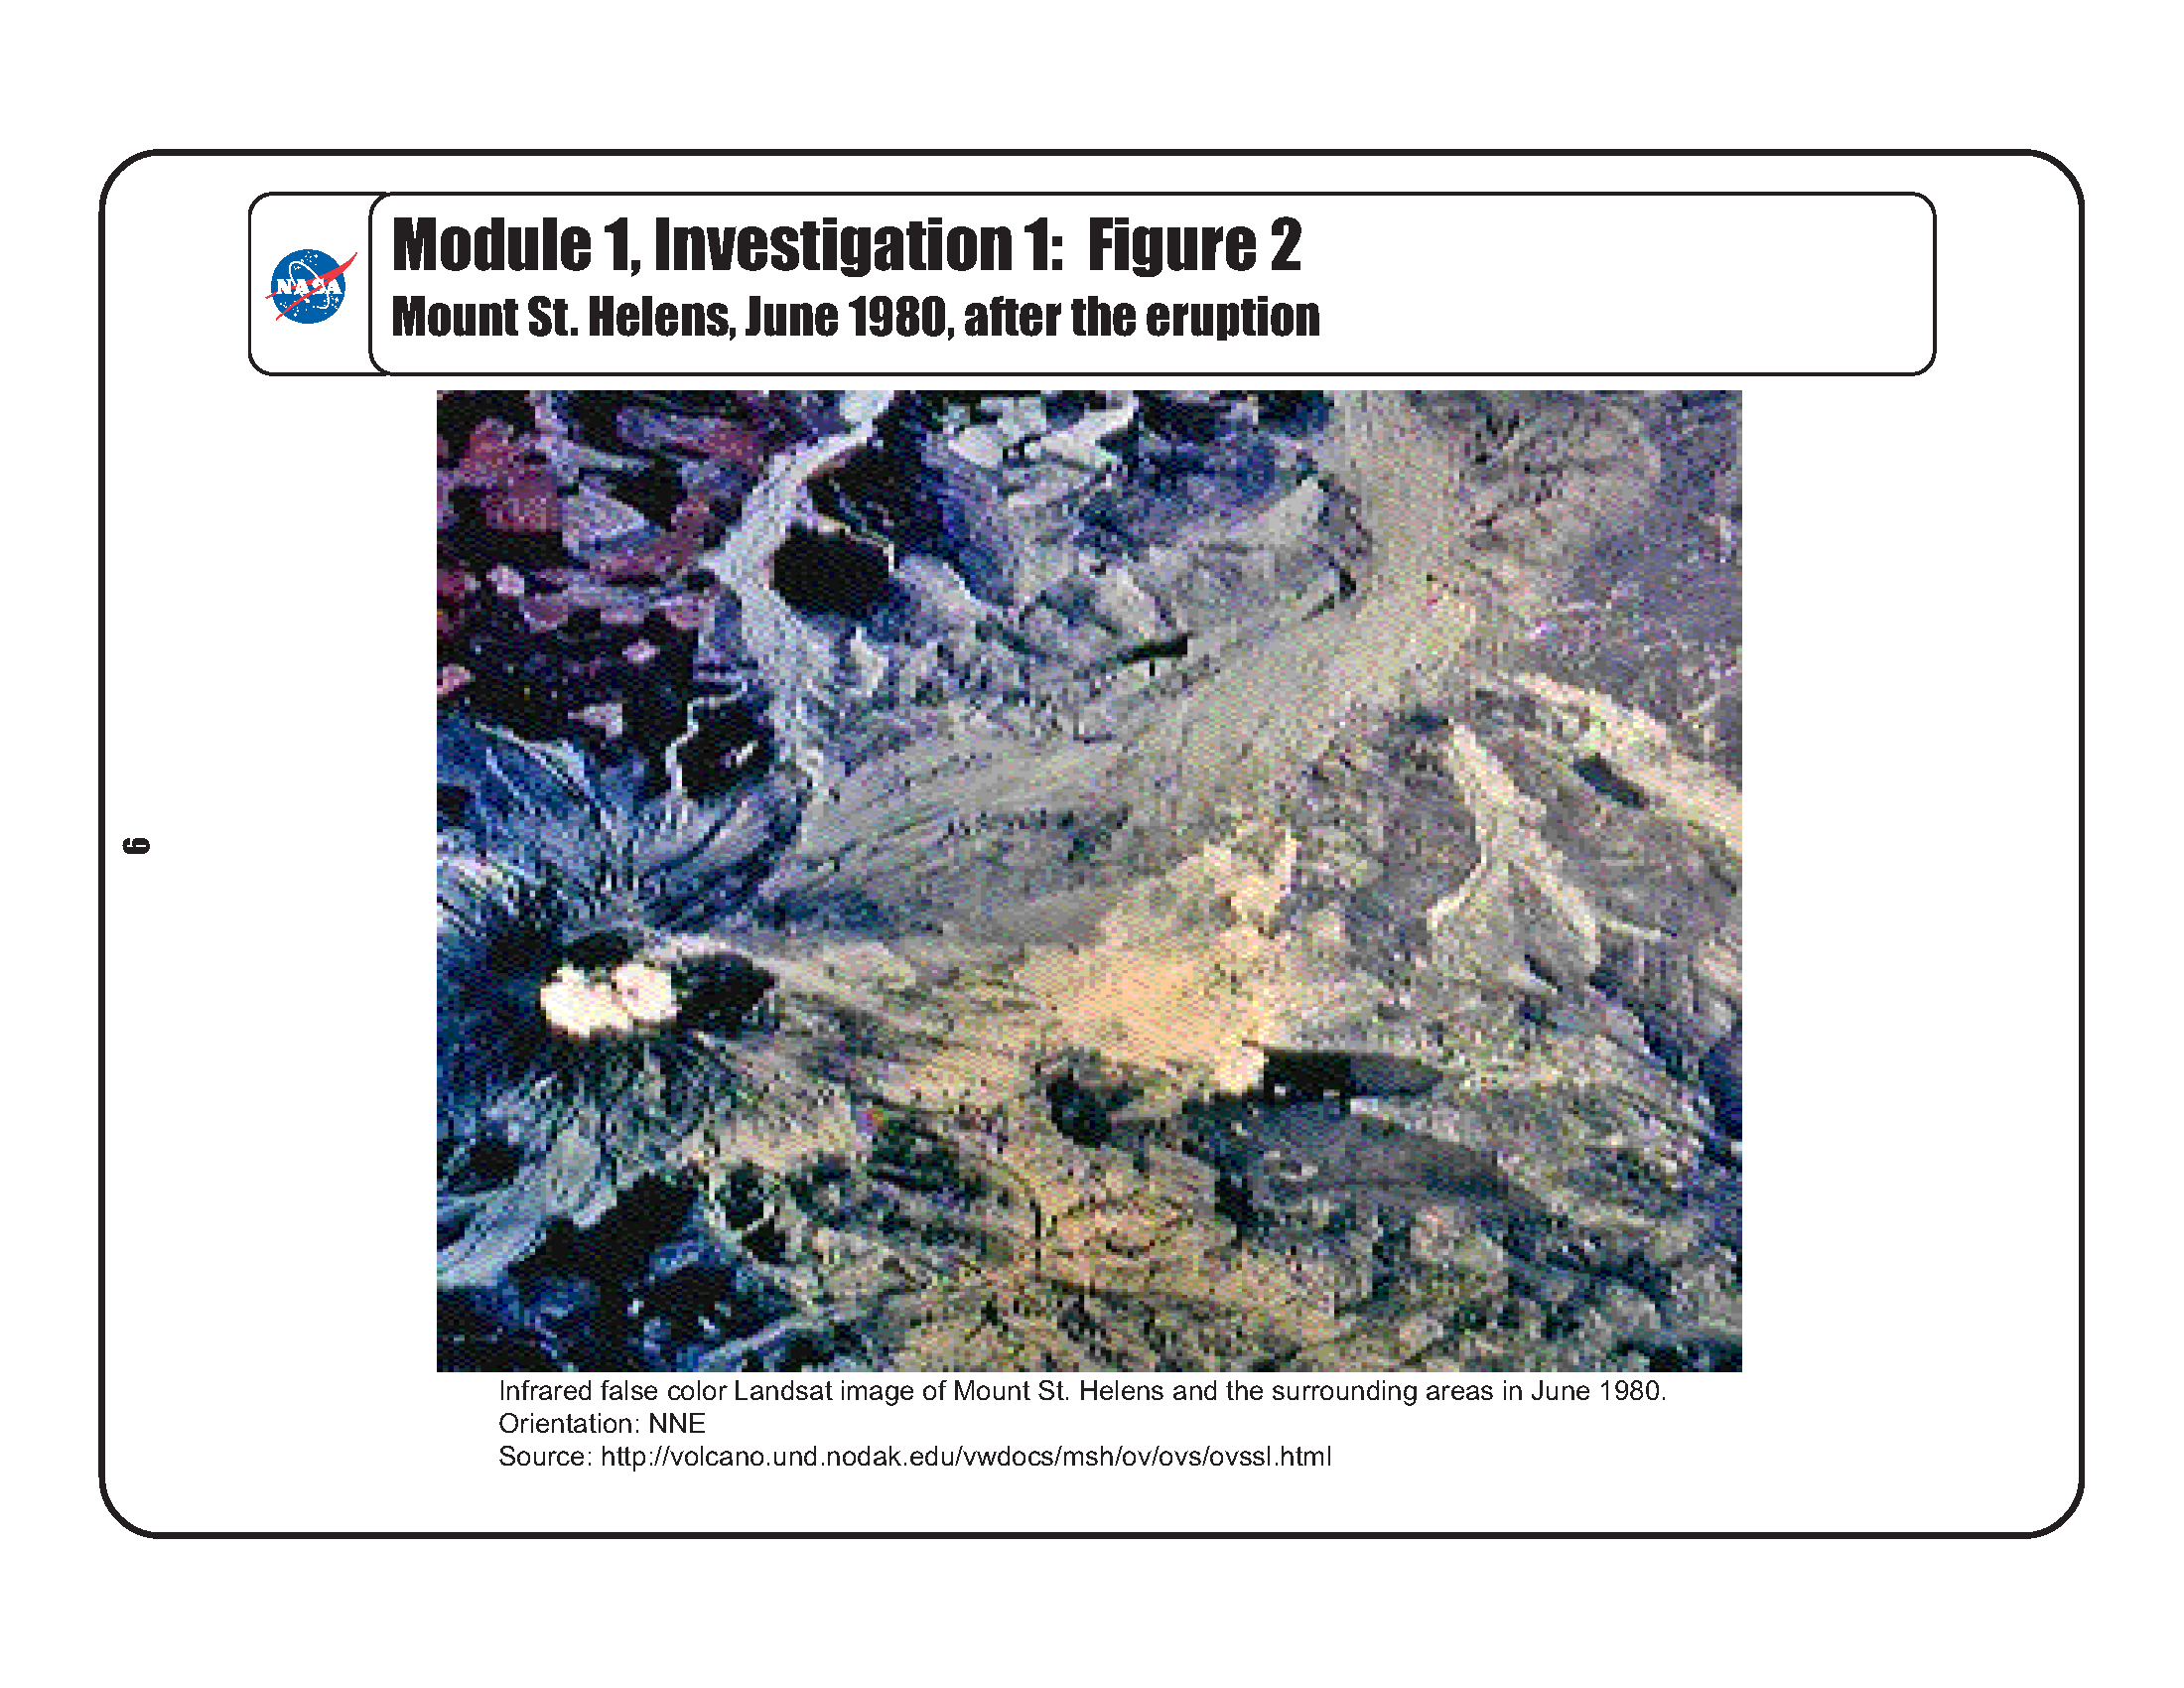
- Figure 2: Mount St. Helens, June 1980, after the eruption
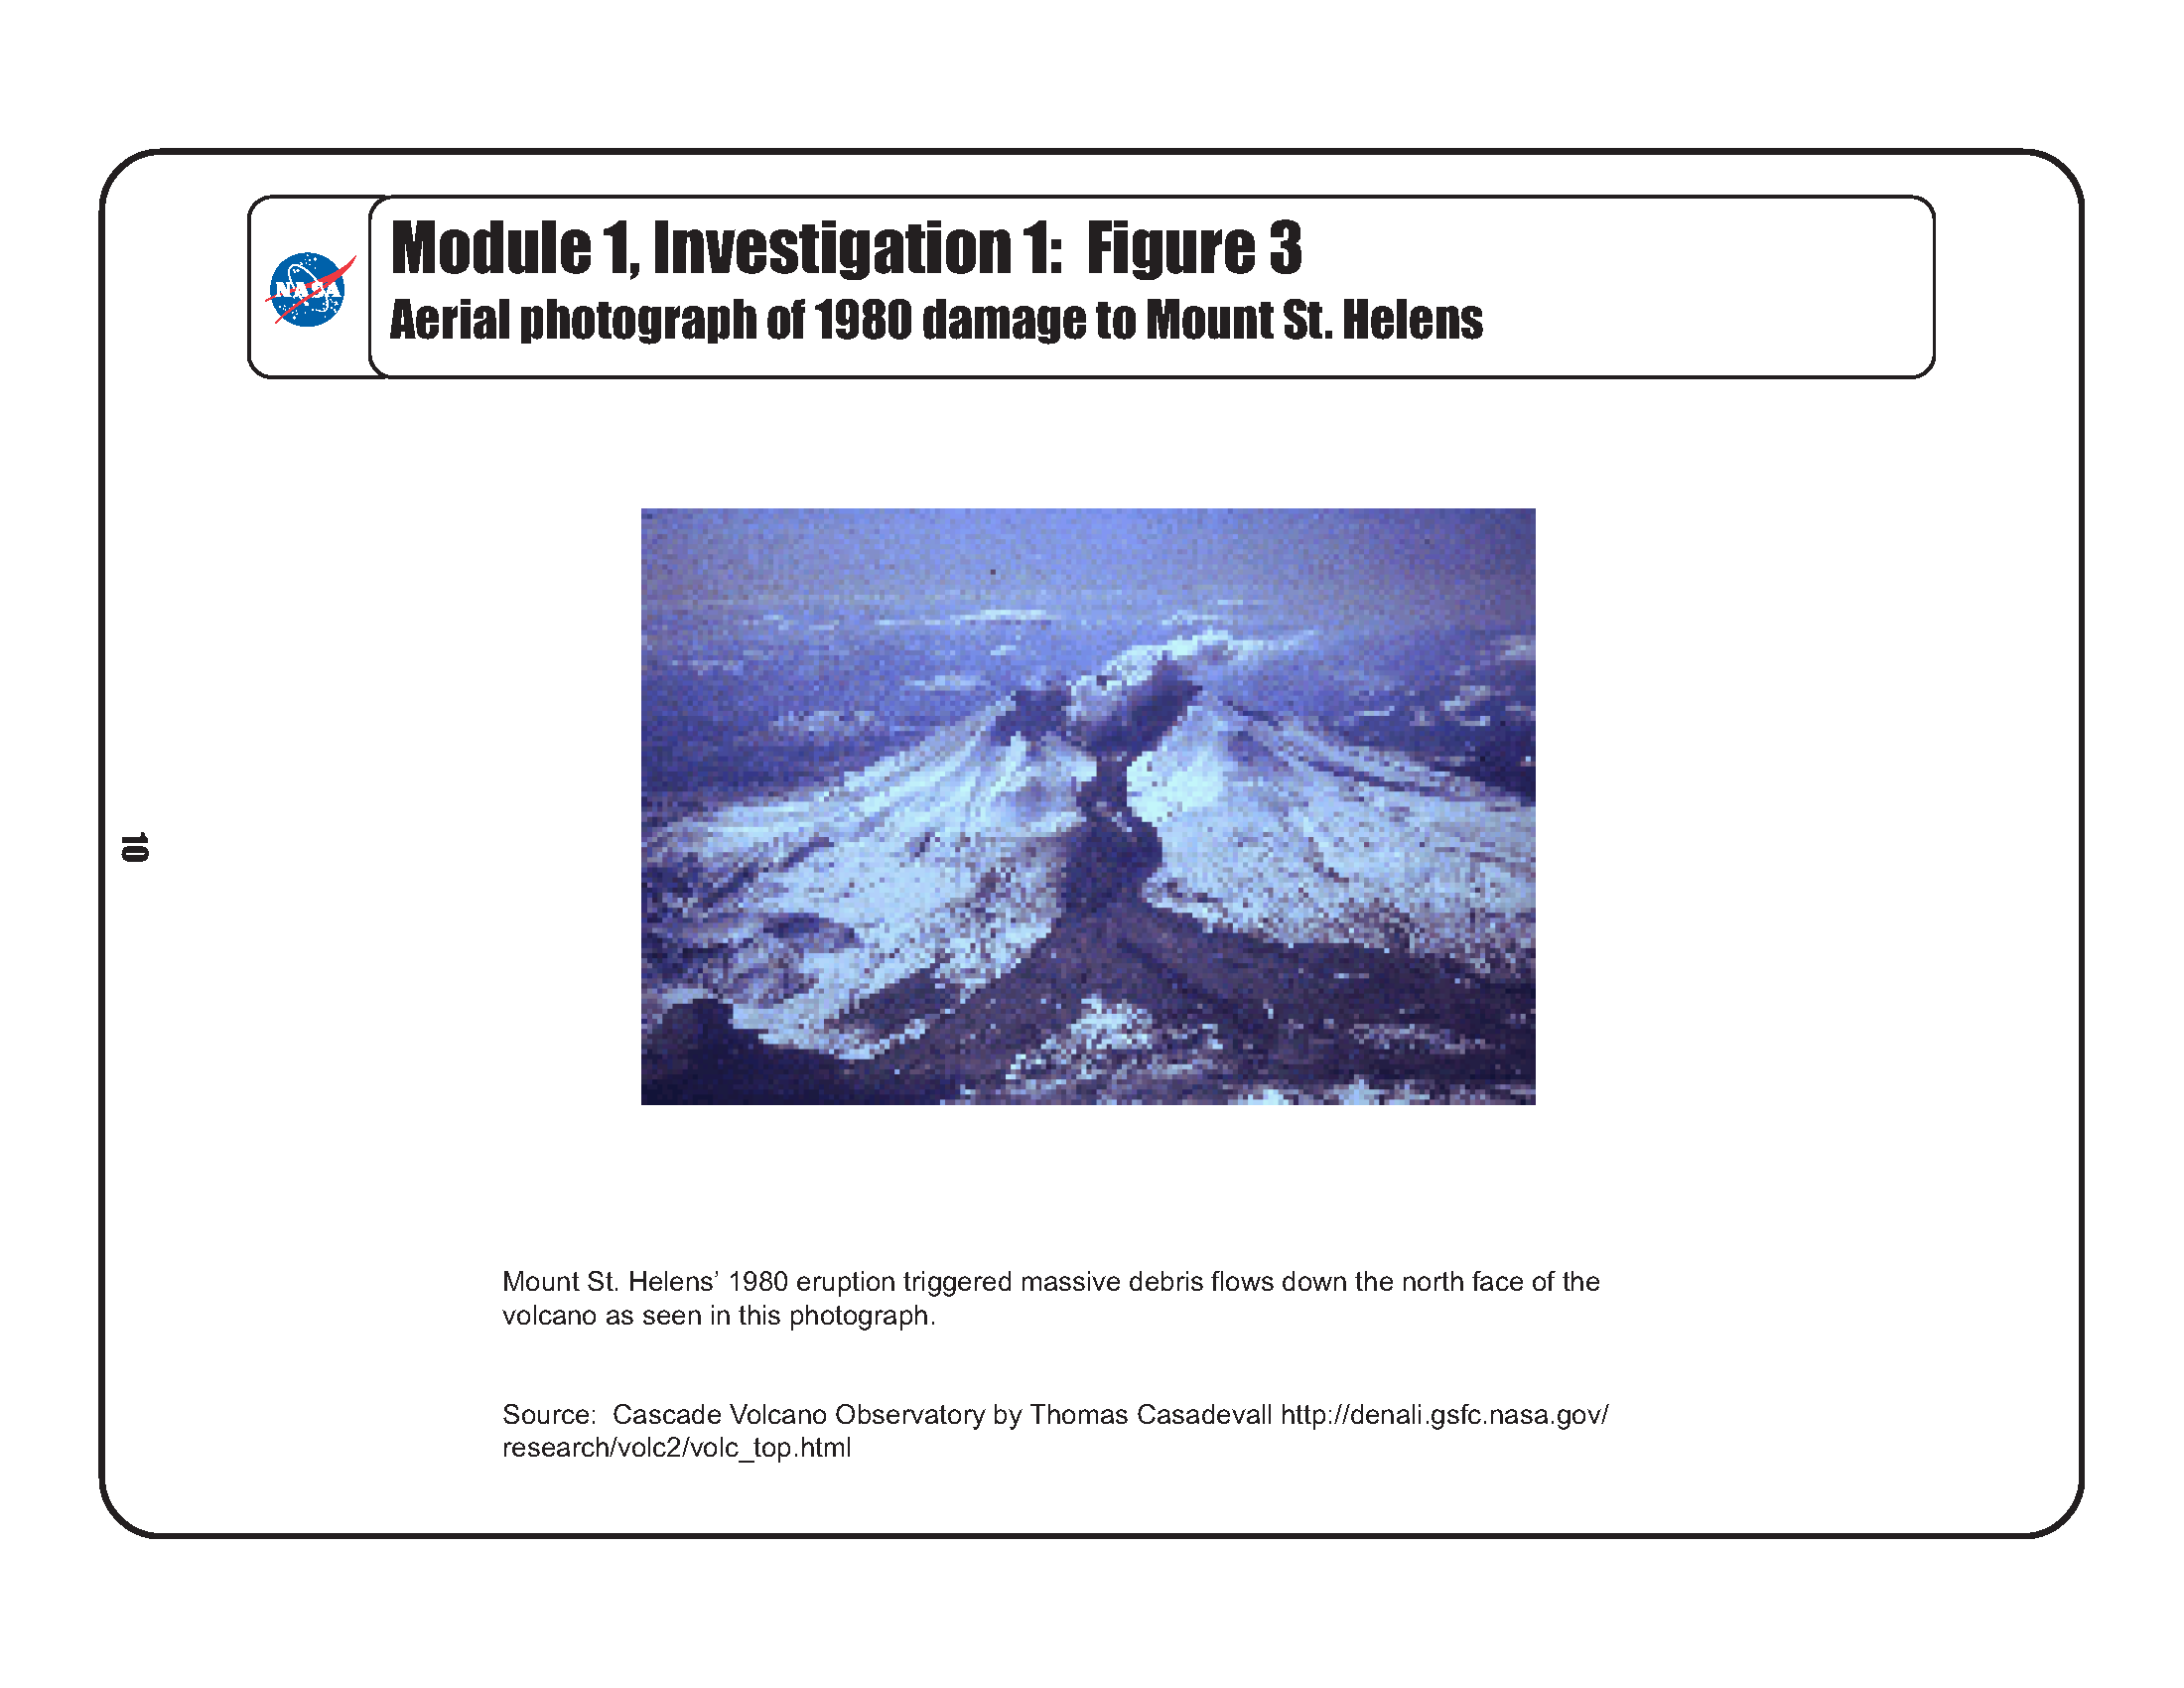
- Figure 3: Aerial photograph of 1980 damage to Mount St. Helens
- Figure 4: Mount St. Helens in 1999
- Figure 5: Mount St. Helens hazards map
- Blank overhead transparency (one per group)
- Five different colors of transparency markers
- Masking tape
Procedure
Beginning the Investigation
- Explain that the purpose of the module is to investigate the effects of volcanoes. Geographers are interested in learning about changes caused by volcanoes at different scales, from the local (immediately adjacent to volcanoes) to the global (world atmospheric conditions affected by volcanic eruptions). Give students time to discuss what they already know about volcanoes and their local-to-global effects.
- Distribute Log 1 and have students read the background and objectives. Distribute the Briefing and have students read the narrative account of Mount St. Helens’ 1980 eruption. You may ask students to take turns reading this dramatic story in a “reader’s theater.”
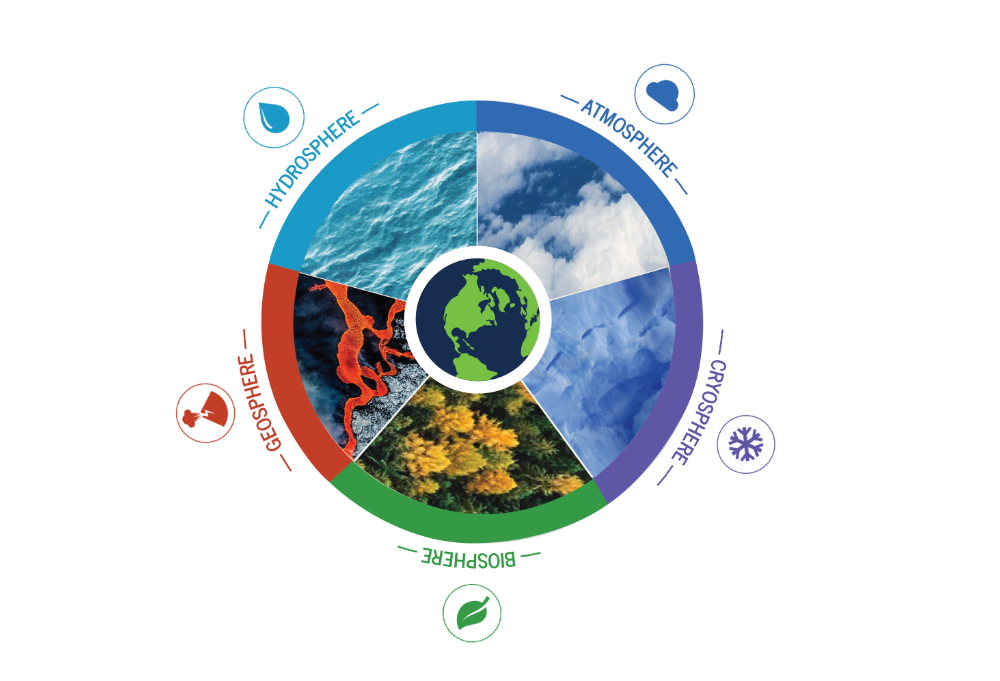
- NASA monitors volcanoes because of their significant effect on people and the environment. Introduce or review the following terms used to describe the environment in Earth-systems terms:
- Hydrosphere: Earth system dealing with water (hydro-), including surface water systems (lakes, rivers, oceans) and frozen water (glaciers, polar ice caps) as well as water beneath the surface of Earth (aquifers, groundwater, etc.)
- Lithosphere (AKA Geosphere): Earth system dealing with land (soil, rocks, etc.)
- Atmosphere: Earth system dealing with air
- Biosphere: Earth system dealing with plant and animal life (flora and fauna)
- Have students record definitions in the Log.
- Divide the class into groups of 3-5 and distribute the Cause and Effect Statements, cut into strips, one set per group.
- Review the statements with students to make sure they understand the vocabulary.
- Ask students to organize the strips into three groups: Causes, Effects, and Human Responses
- Some statements may require a fine distinction between “cause” and “effect”; develop working definitions as a class if necessary. (Suggested definitions: Cause—incidents that lead up to or are related to the actual eruption event. Effect—incidents that result from the actual eruption event).
- Students complete Item 3 in the Log.
- Using large sheets of poster paper and tape, have students classify the statements again, this time into more specific categories shown in Log 2: Cause and effect organizer.
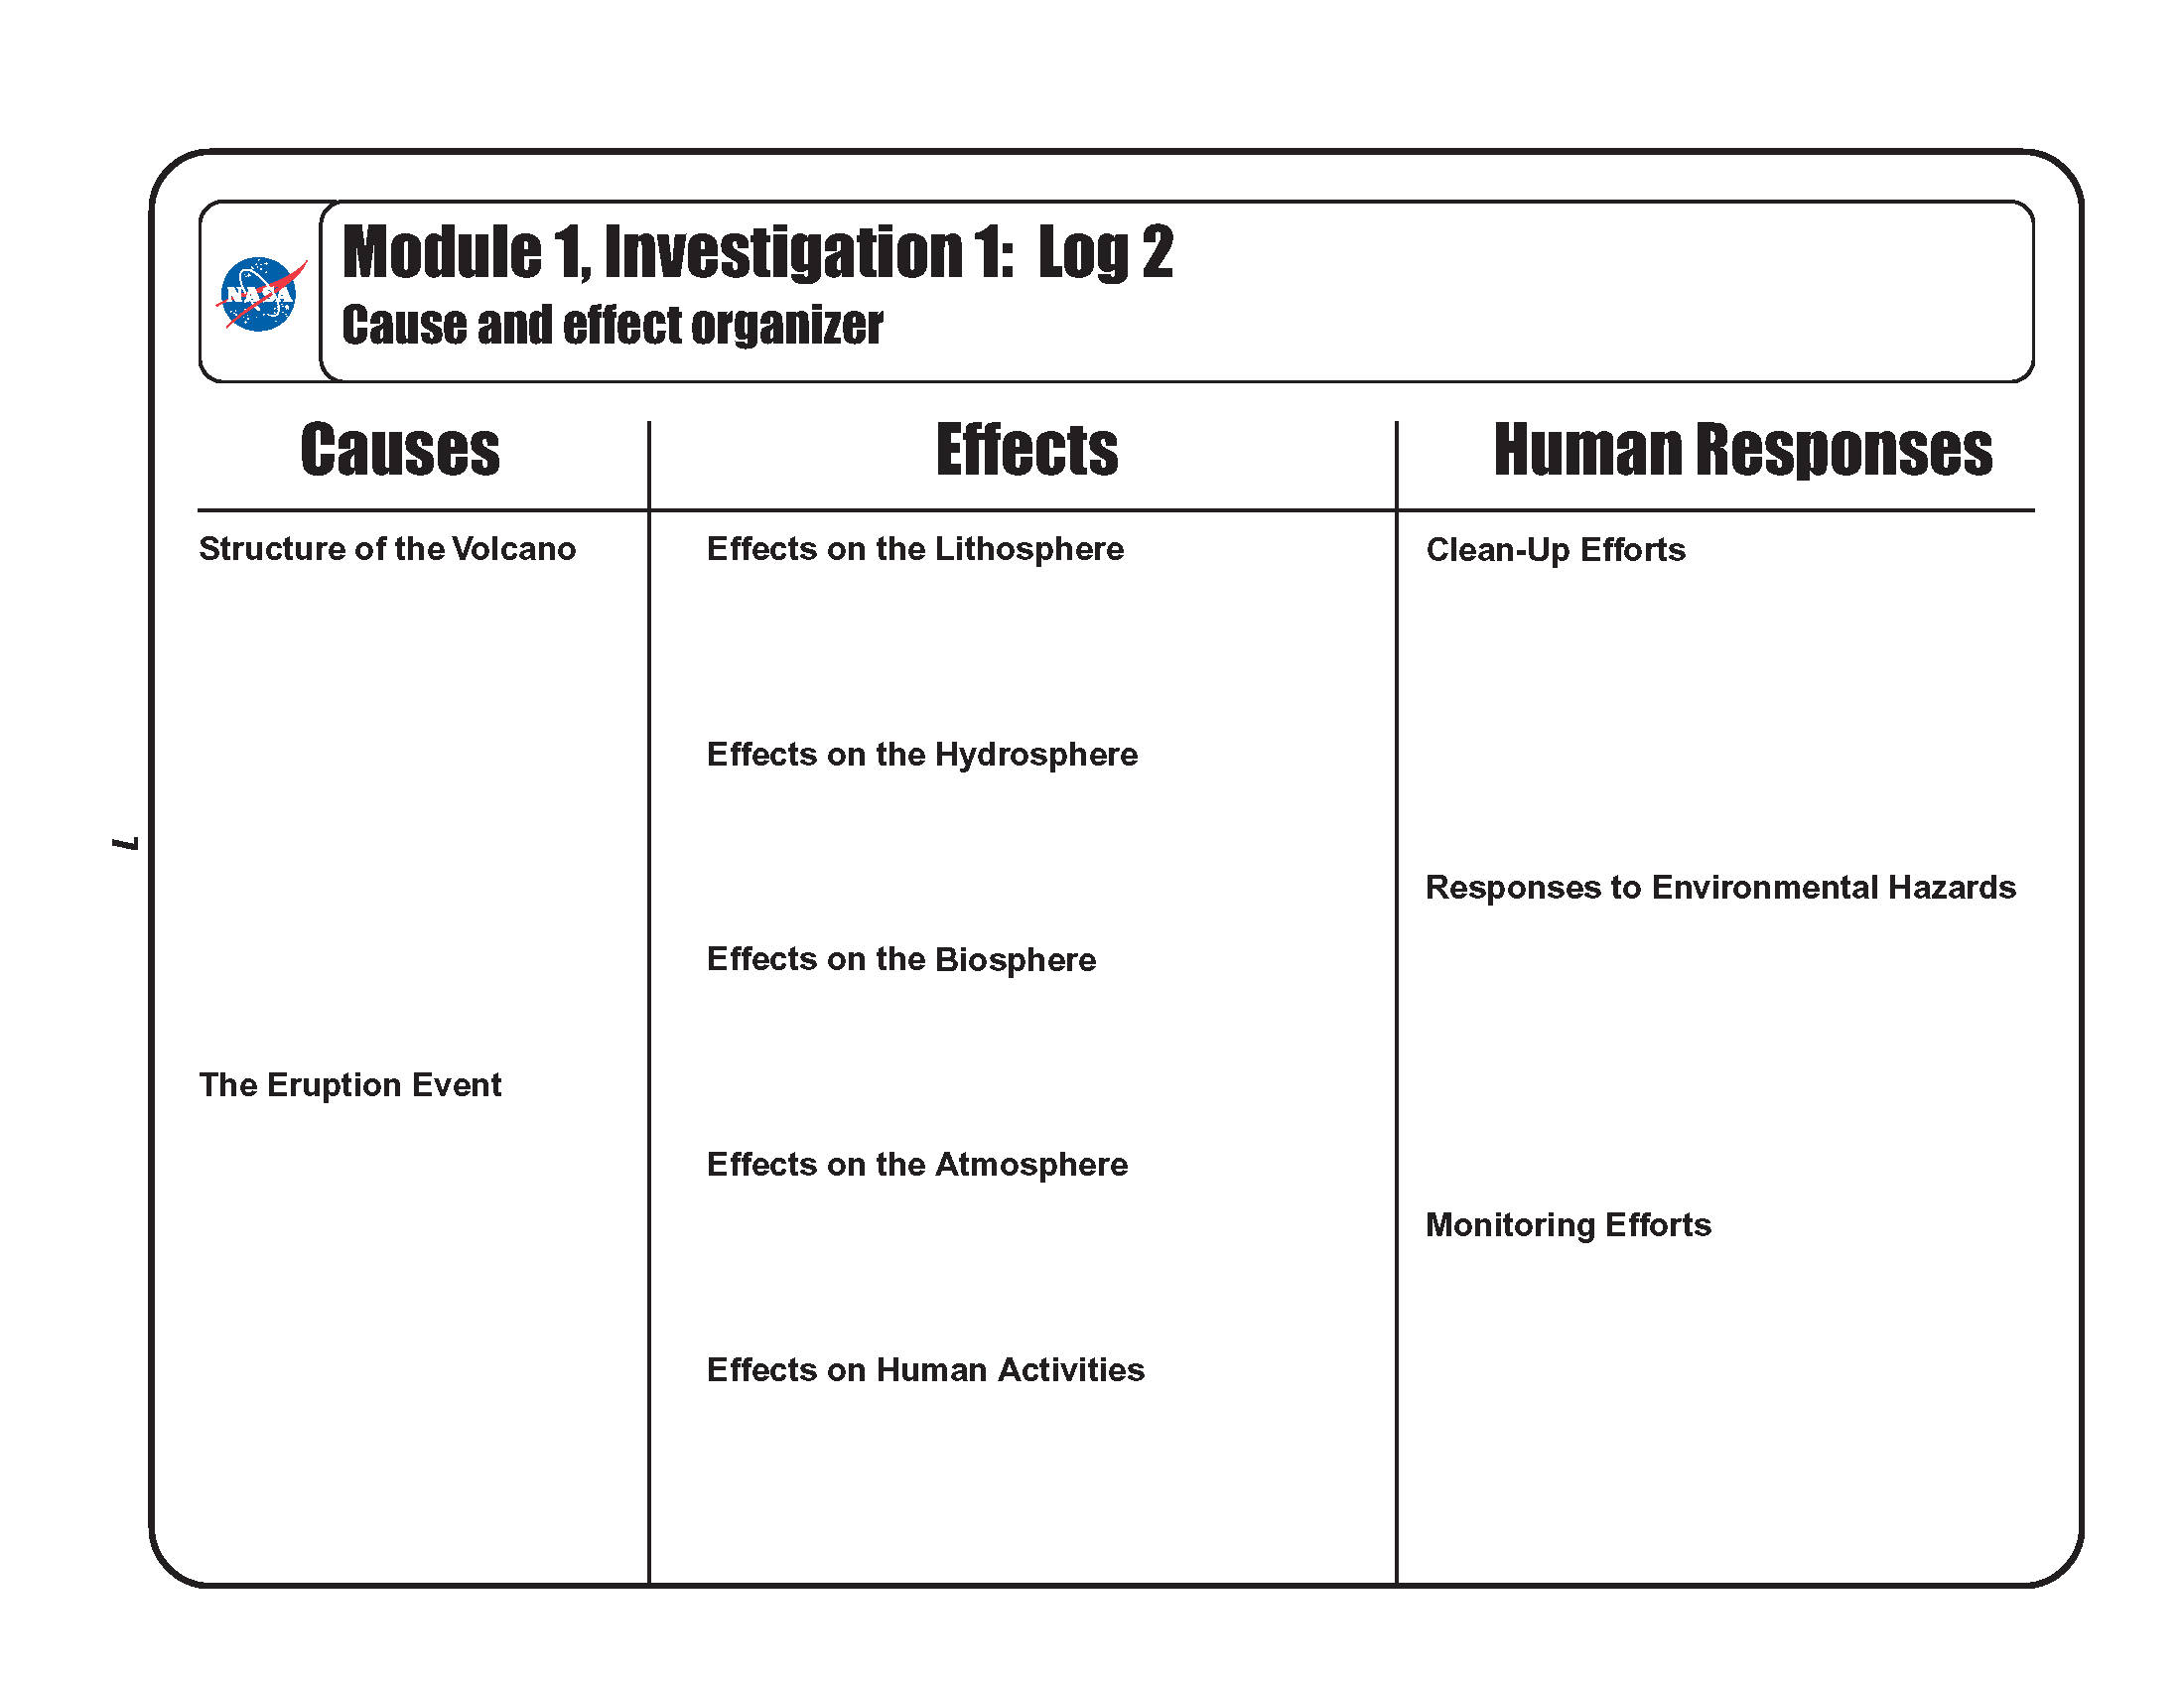 Be sure that all students understand the categories. Discuss the types of cues they would use to determine a statement’s classification. For example, students should identify that statements dealing with the plant and animal life of the area would be placed under “Effects on the Biosphere.”
- Students record their categorizations on Log 2.
- Ask selected groups to share their classifications with the class. If groups disagree about a statement’s classification, allow them to explain their underlying thought process. Use points of disagreement to reinforce the concept that Earth systems function interdependently, so it is sometimes difficult to determine which “-sphere” is being affected.
- Debrief this activity by highlighting that effects and consequences such as the ones listed require considerable lengths of recovery time after an eruption. How people prepare for and respond to volcanic eruptions is vital to the safety and productivity of an area. Explain that NASA images show the extent of damage after an eruption and provide data useful to lessen the human impacts of possible future eruptions.
Developing the Investigation
- Distribute Figure 1: Mount St. Helens, March 1980, before the eruption to each group. Explain that this is a false-color Landsat image, which means that the colors on the image are not the same as would appear to the human eye. In this image, vegetation is red.
- Guide students in interpreting the image using the following questions:
- What features would you look for in order to identify a river? (Look for meanders or curves in a line.)
- How would you identify the location of the volcano’s peak? (Look for dark gray or black areas surrounded by little vegetation. These represent snow and glaciers that are on top of the volcano.)
- How would you find areas of vegetation? (Look for red areas since this is a false-color image and living vegetation is reddish.)
- Why might some areas of vegetation have straight boundaries? (They are probably boundaries for agricultural land or some other managed landscape.)
- Have students complete item 4 in the Log.
- Ask students to review the Cause and Effect Statements they organized earlier in the investigation. Have them record in their log three things that they would expect to be able to observe in a false-color image taken after an eruption. Allow students to discuss their predictions with the class. They should mention things like:
- less red color because much of the vegetation was killed by the blast
- changes in the course of rivers or the development of new lakes as debris obstructed the flow
- of rivers
- changes in the shape of the volcano due to landslides
- Distribute a blank overhead transparency and transparency marker to each group. Instruct students to mark the corners of Figure 1 on the transparency to aid in lining up other images later.
- Ask students to locate the summit of the volcano (in the lower-left area of the image) and then trace the extent of the volcano. Students should create a key at the bottom of the transparency for each color used throughout the investigation.
- Explain the concept of a buffer. A buffer provides an area to absorb the negative consequences of physical or human activities. For example, tree buffers can serve to protect a neighborhood from highway traffic and noise, while an uninhabited buffer area can protect people from some dangers of natural hazards. In a different colored transparency marker, ask students to sketch the area they think should be the buffer zone for safety around Mount St. Helens.
- Distribute Figure 2: Mount St. Helens, June 1980, after the eruption.

- Instruct students to compare this figure to Figure 1.
- Have students discuss their reactions to the changes from Figure 1 to Figure 2. In what ways was the environment disturbed and disrupted by the eruption? In what ways was vegetation altered? The flow of rivers? Students should check to see the changes they predicted. Were their predictions accurate?
- Have students place the transparency on Figure 2, lining up the corner marks.
- In another color, have students trace the boundary of the extent of the disruption and devastation brought on by the eruption. Ask how effective their buffer would have been for this particular eruption.
- Have students review the Cause and Effect Statements again to imagine what the area in this image would look like at ground level. Then, display Figure 3: Aerial photograph of 1980 damage to Mount St. Helens to illustrate what the land looked like after the eruption.
- Ask students to formulate a hypothesis about the present environment around Mount St. Helens. What would it look like today?
 Using a new color transparency marker, have students draw in with dashed lines how much of the area they think probably still shows effects of the 1980 eruption today.
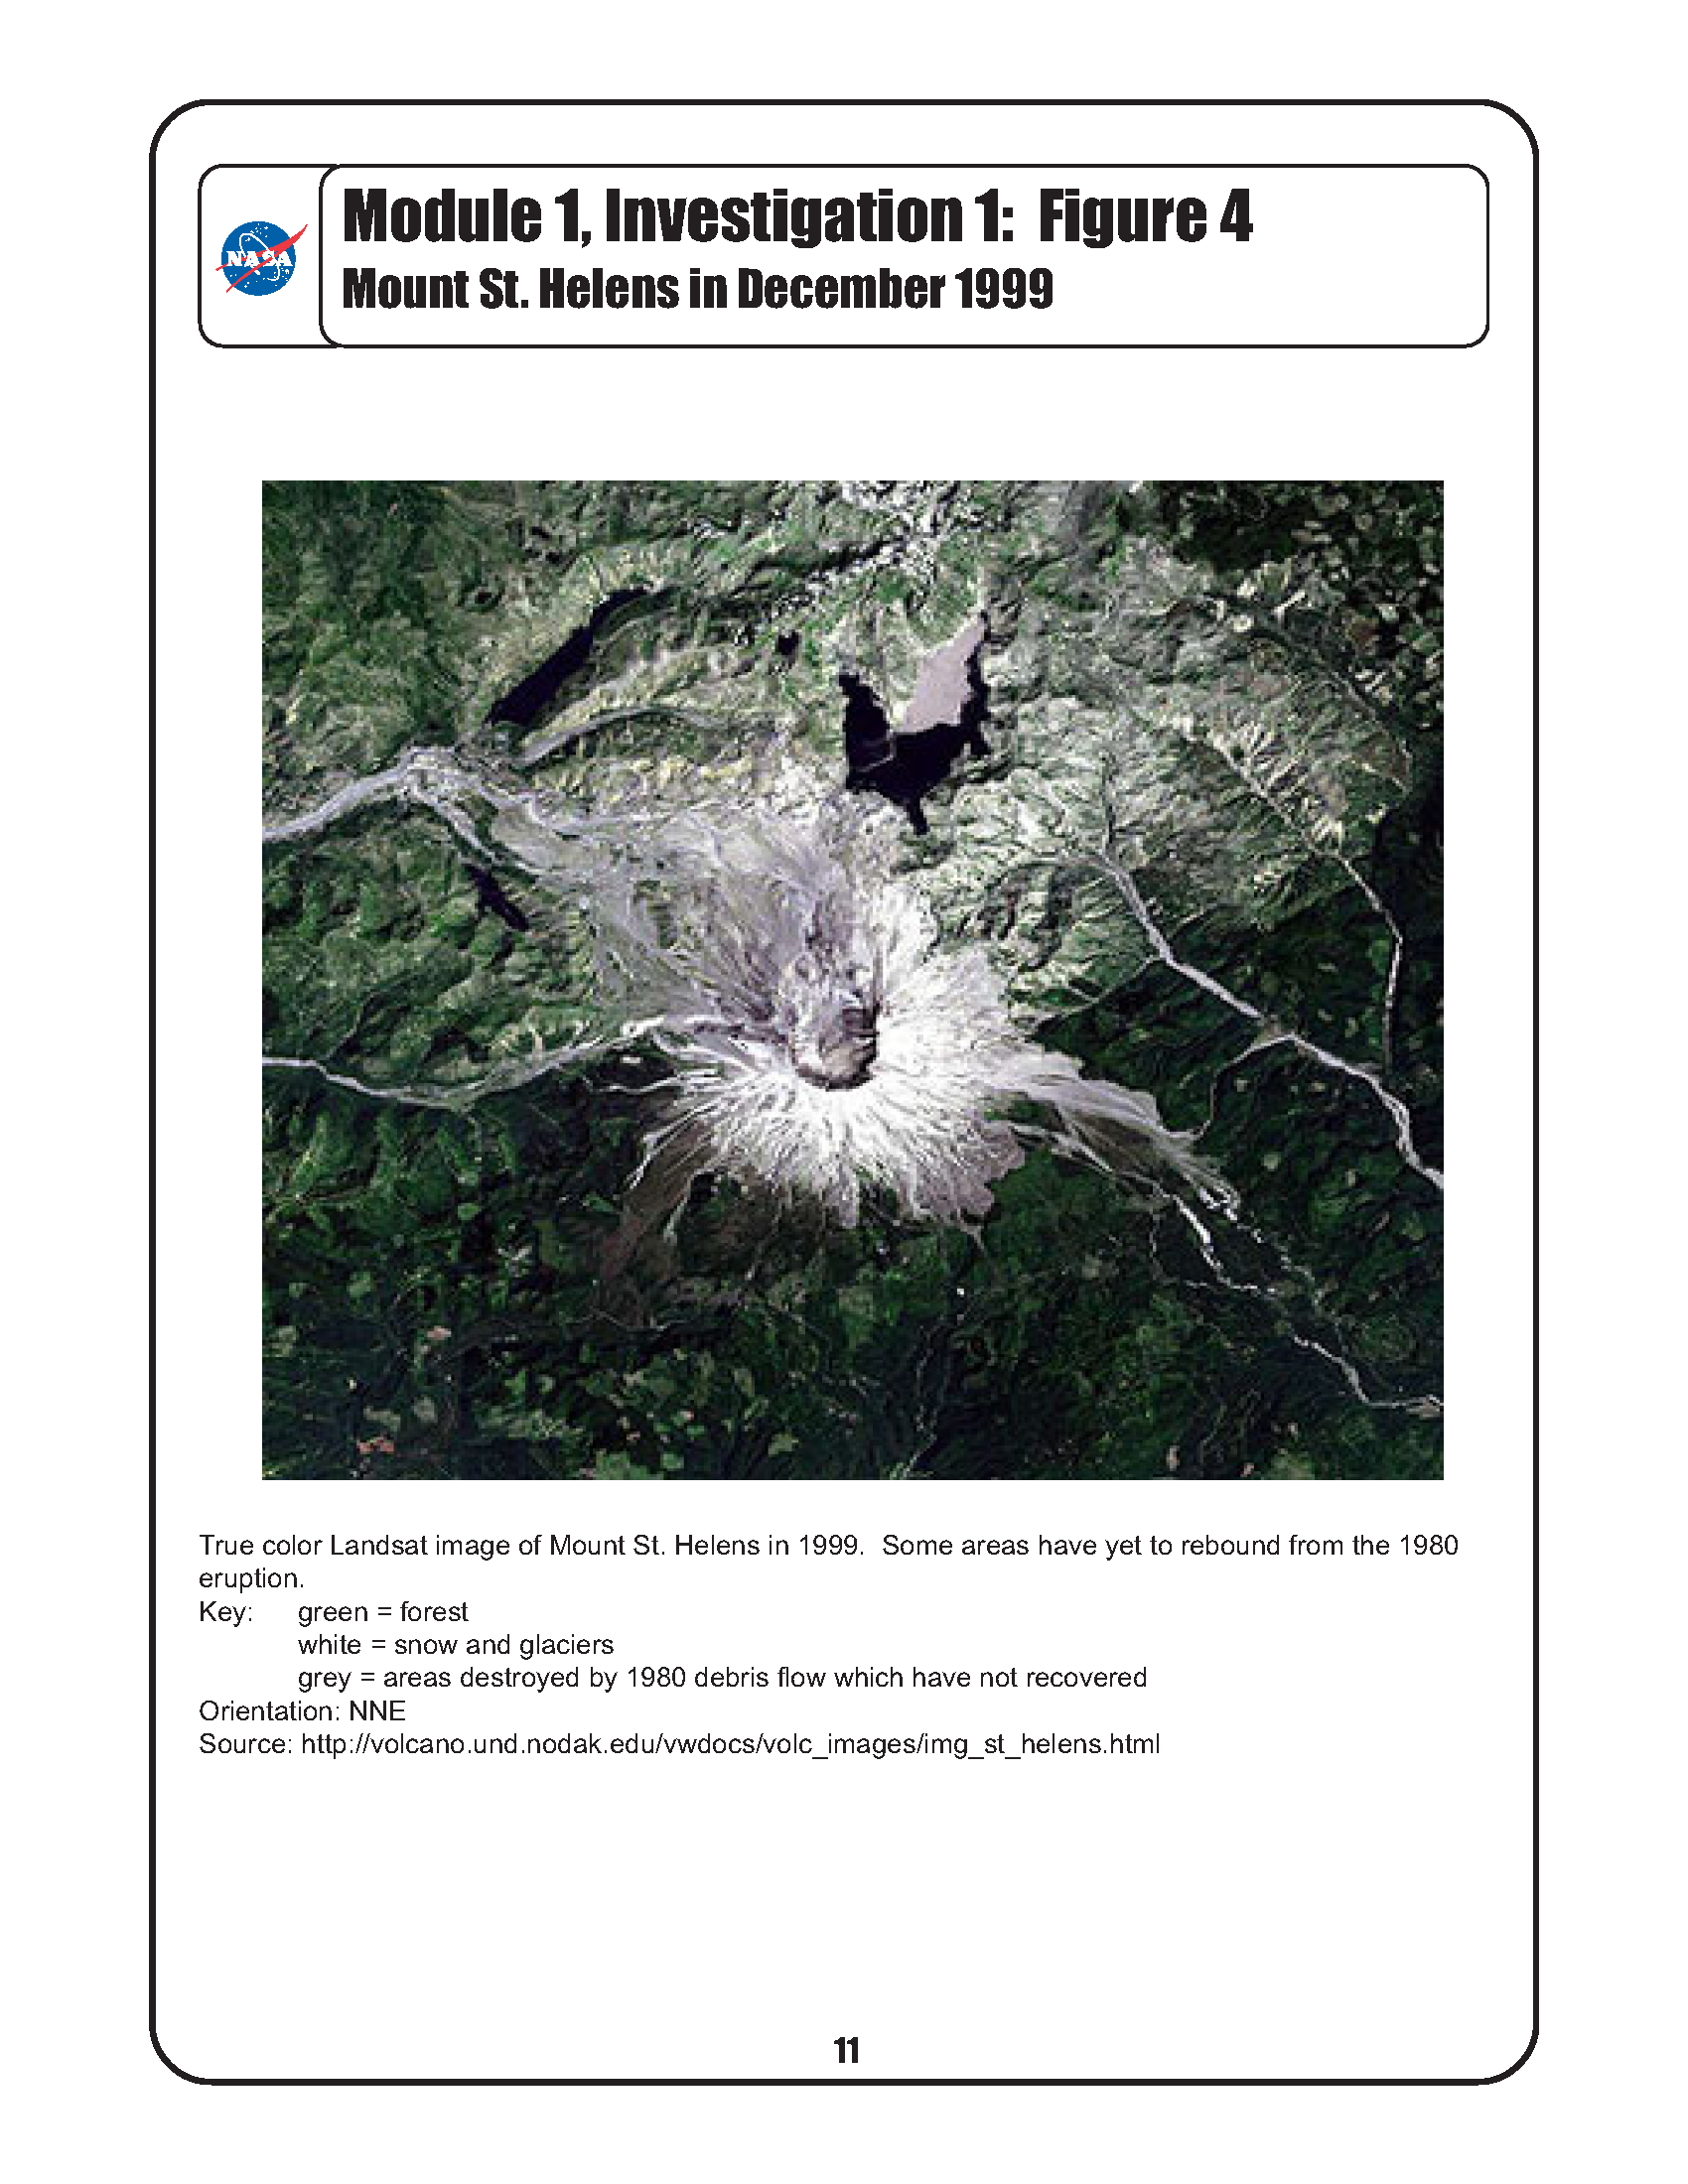
 - Distribute Figure 4: Mount St. Helens in December 1999. Students need to line this image up with the lower right corner of their transparency. Explain that instead of vegetation appearing red, in a true-color image vegetation looks green like it does in the real world. Ask students to compare this image with the previous two. How has the local environment changed? Ensure that students notice the vegetation regrowth in some areas. Where has regrowth occurred, and where has it not? Have students look for patterns and explanations for the areas of regrowth. (Explanations could include: The impact was more severe and lasting in the direction of the blast. The area directly adjacent to the volcano was slowest to grow vegetation. Areas along the river and surrounding Spirit Lake have begun to recover vegetation.)
- Using a different color marker, ask students to draw a second safe buffer zone around the volcano applying this new information. Students should record their justification for the boundary by stating which effects are being addressed by their new buffer zone.
Concluding the Investigation
- Compare the second buffer zone to the buffer they drew originally. Ask how many groups made their second buffer zone bigger. Students may assume that the next eruption will affect the same area, which would not necessarily be the case. Ask what other information students or scientists would need to create a buffer zone that took this possibility into account.
- Remind students that scientists are constantly monitoring changes with volcanoes, hoping that new information will help the area be safer and more prepared for potential eruptions. Using data from several different years allows people to make wiser decisions. If students changed their buffer zone, they understand the need to respond to additional information about dangers.
- Circulate Figure 5: Mount St. Helen's hazards map for students to compare their second buffer zone area with the hazard areas identified by the U.S.
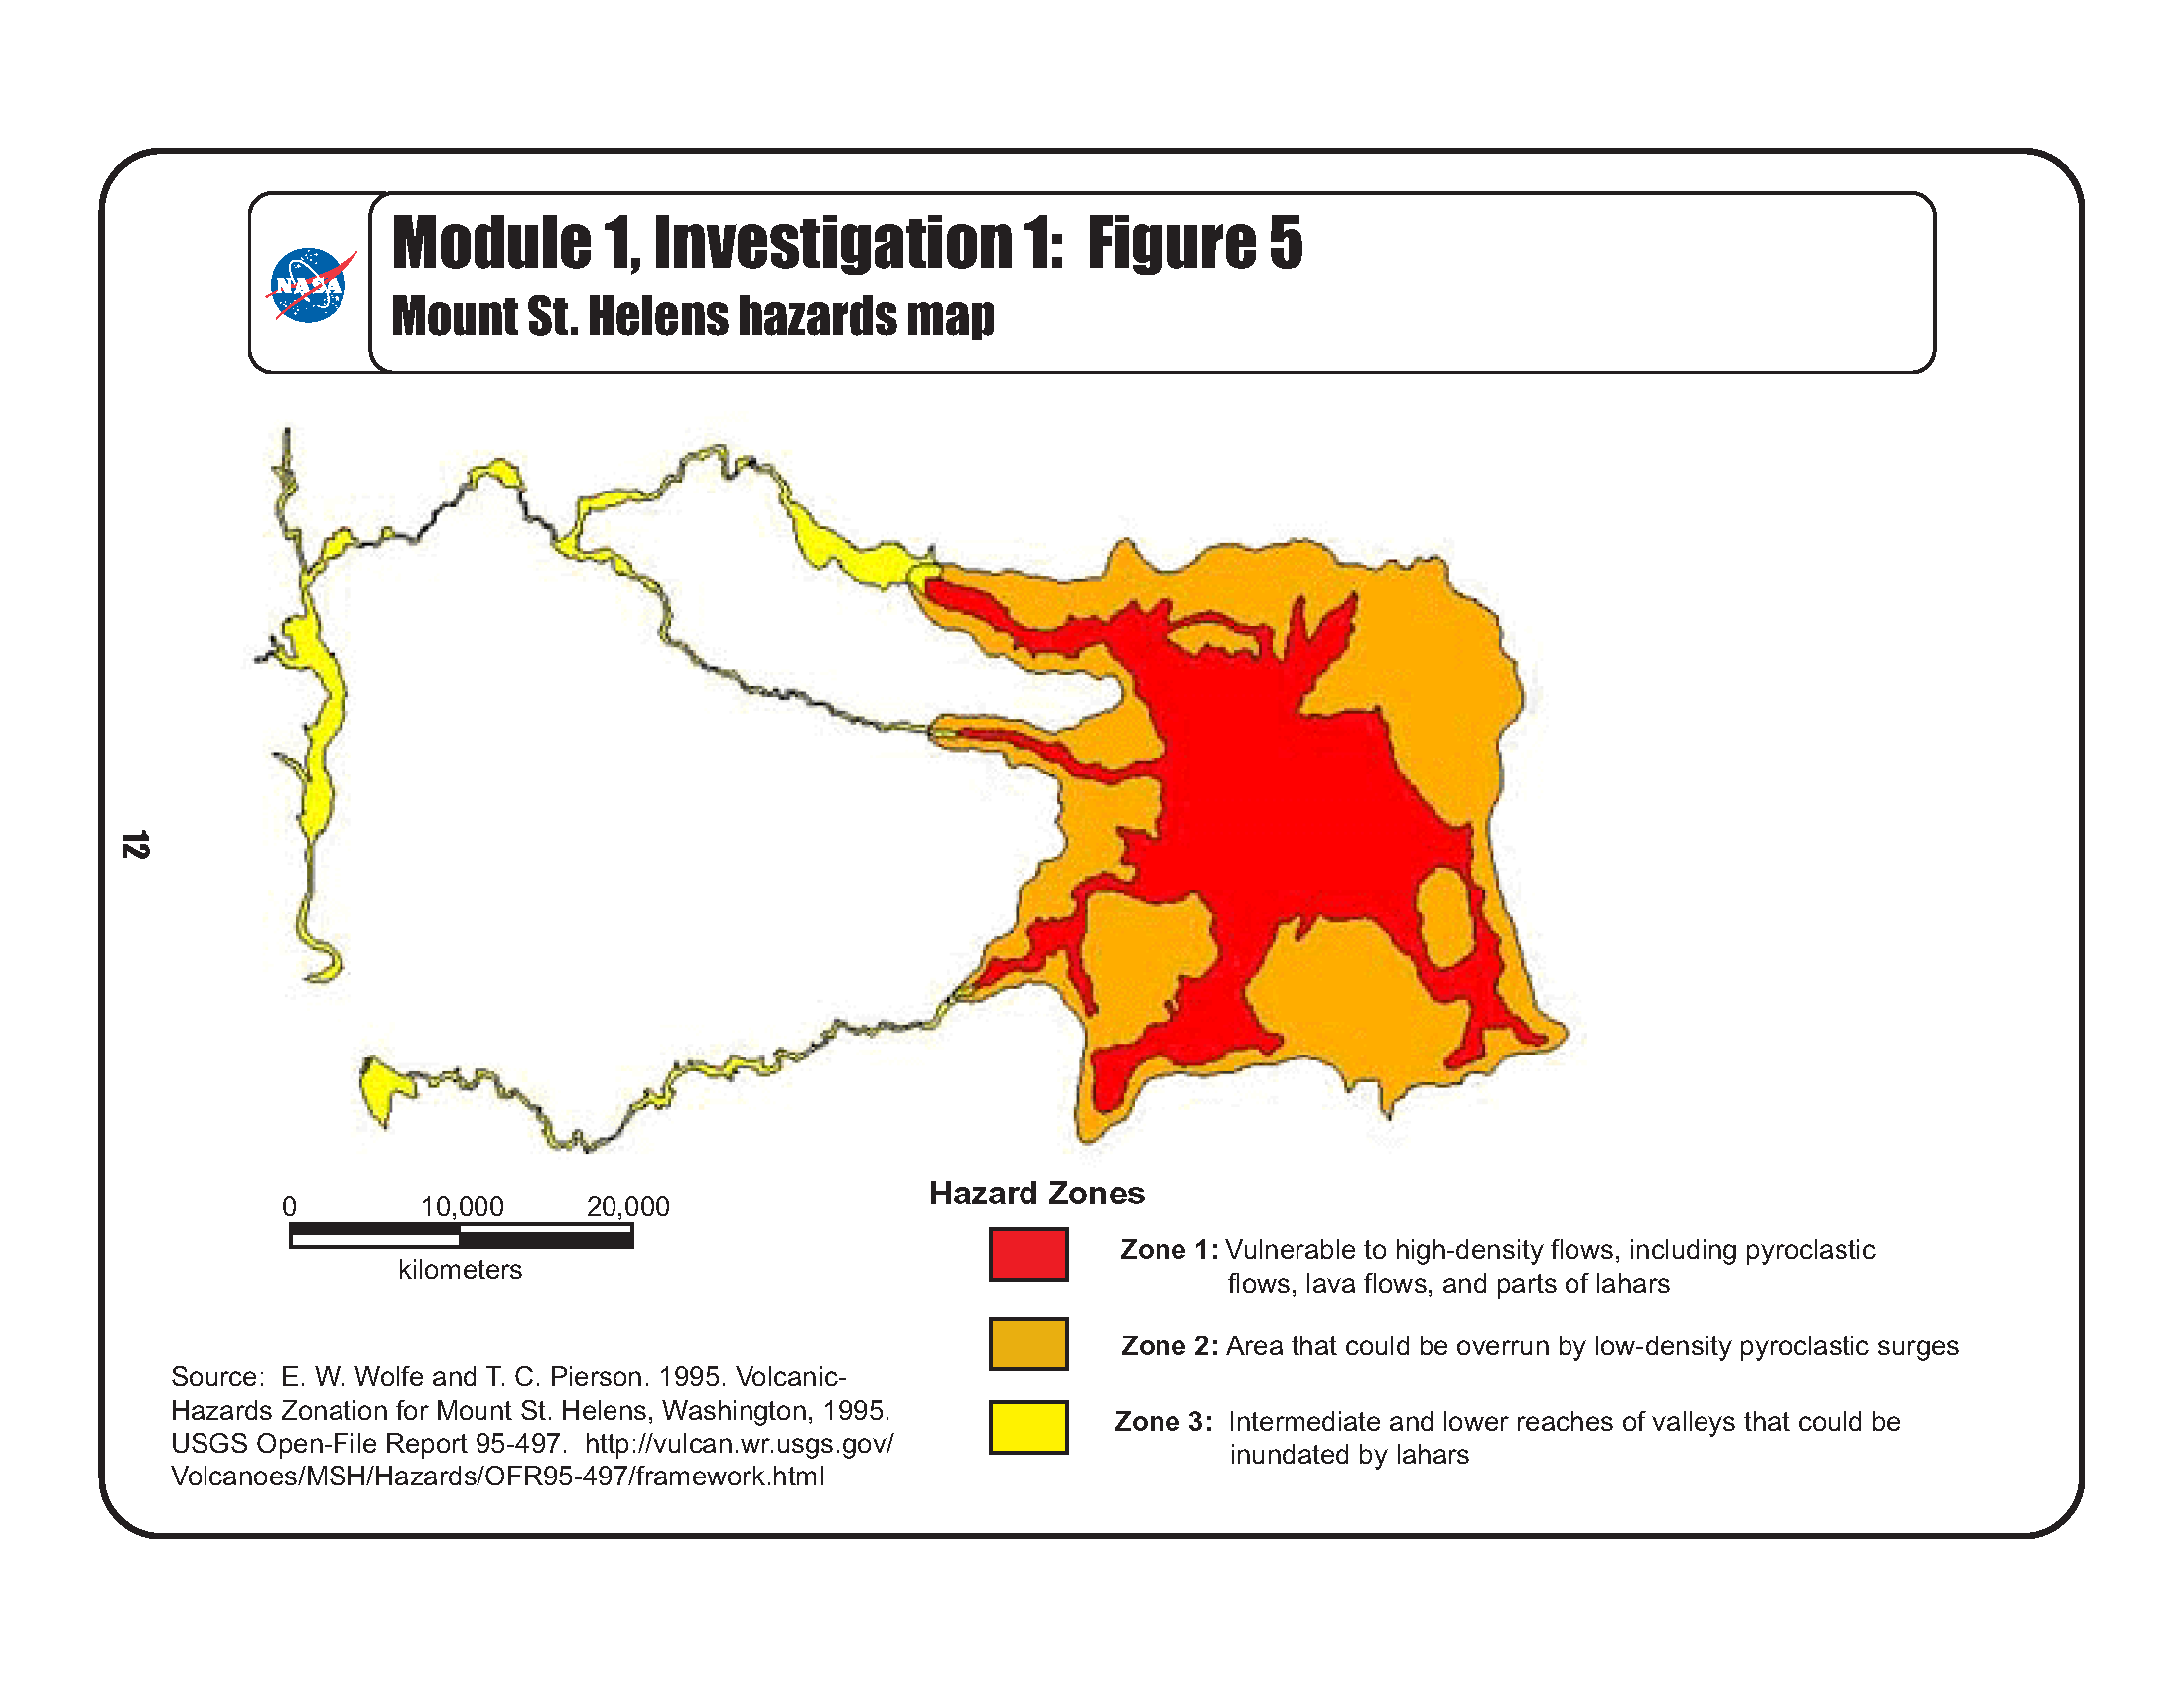 Geological Survey.
 - Ask students to review the Cause and Effect Statements they used at the beginning of the investigation. Have them identify which effects may have been less of a problem if there had been a sufficient buffer zone in place before the 1980 eruption of Mount St. Helens. Have students record their answers in their Log. Provide time for whole group discussion of the possible effects and limitations of buffer zones.
Related NASA Resources
- Earth Observation System Volcanology Homepage, provides comparative information on a variety of volcanoes under study. Includes eruption data as well as satellite and aerial images of each.
Related Resources
- Links to information about Mount St. Helens. Includes details of the 1980 eruption, maps and graphics of the Cascades Volcanoes, monitoring efforts, and more.
- Summary of the 1980 eruption event, including measurements and extent of damage
- MtStHelens Landsat progression of images with additional pictures of selected sites
- Alaskan Volcano Observatory, outstanding images and text about all volcanoes in Alaska, the Aleutian Islands, and Kamchatka Peninsula. Regional and local maps. Images of volcanoes, their eruptions, and the effects on the nearby human populations
Disciplinary Core Ideas:
- ESS2B: Plate Tectonics and Large-Scale Systems
- ESS3B: Natural Hazards
Crosscutting Concepts:
- Cause and Effect
Science and Engineering Practices:
- Analyzing and Interpreting Data
- Categorize the impacts of volcanism on the different spheres of the Earth system
- Suggest ways humans can prepare for and adapt to volcanoes of Earth’s physical system
Where should a buffer zone be established around Mount St. Helens?
Geographers conceptualize the Earth in terms of physical systems (the lithosphere which is also known as the geosphere, the biosphere, the hydrosphere, and the atmosphere) and human systems that are unified in a single, highly-interconnected system. Changes in one system lead to changes in other systems, with an impact on a variety of scales, from local to regional to global. Volcanoes provide an outstanding opportunity to highlight the relationships between human and physical systems and how humans deal with natural hazards.
Volcanoes are dangerous, but they are also very important to humans. Volcanic eruptions contribute substantially to soil fertility. In the Andes, many people live on the flanks or at the foot of active composite volcanoes, largely because of the fertility of the volcanic deposits. The same is true in the Philippines where residents near active volcanoes like Mount Mayon and Mount Taal regularly move away during eruptions, only to move right back when the danger subsides. These two cases present good examples of how people learn to live and adapt to hazardous environments.
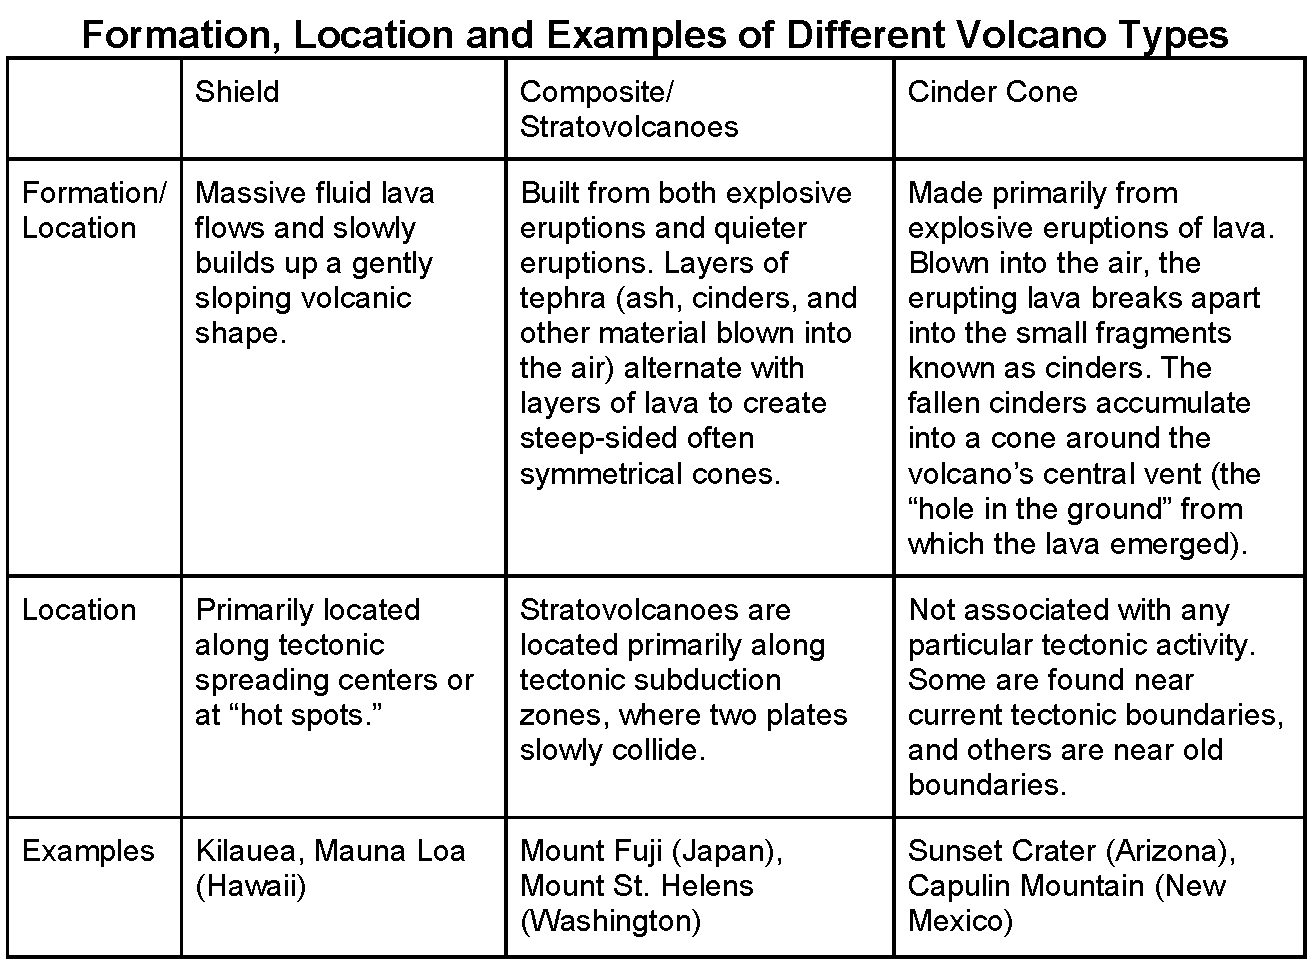
Mount St. Helens is one of many composite (stratovolcano) volcanoes in the Cascade Range of the Northwest United States. Mount St. Helens has been one of the most active volcanoes in the Pacific Northwest, although before the eruption in May 1980, it had been dormant since 1857.
More detailed information about the Cascade Range, Mount St. Helens, and the 1980 eruption can be found at the USGS/Cascade Volcano Observatory web site.
- Students should be familiar with basic structure of Earth's interior.
- Students should know what the spheres of Earth represent in order to classify effects on the spheres. This includes the atmosphere, biosphere, hydrosphere and lithosphere.
- Volcanoes are randomly located across the earth’s surface.
- Volcanoes are found only on land.
- Volcanoes are found only in hot climates.
- All volcanoes erupt violently.
- Volcanoes only erupt straight up through the top vent.
- If a volcano doesn’t erupt for a hundred years, it’s extinct.
- If a volcano does not produce lava, it is not dangerous.
Geotechnical Engineer - A geotechnical engineer is a type of civil engineer who focuses on the mechanics of the land, rocks, and soils in the building process. This type of engineering includes, but is not limited to, analyzing, designing, and constructing foundations, retaining structures, slopes, embankments, roadways, tunnels, levees, wharves, landfills, and other systems that are comprised of rock or soil.
Data Visualizer - At the core of scientific visualization is the representation of data graphically - through images, animations, and videos - to improve understanding and develop insight. Data visualizers develop data-driven images, maps, and visualizations from information collected by Earth-observing satellites, airborne missions, and ground measurements. Visualizations allow us to explore data, phenomena and behavior; they are particularly effective for showing large scales of time and space, and "invisible" processes (e.g. flows of energy and matter) as integral parts of the models.
Remote Sensing Specialist - Remote sensing scientists use sensors to analyze data and solve regional, national and global concerns. For instance, natural resource management, urban planning, and climate and weather prediction are applications of remote sensing. Many scientists develop new sensor systems, analytical techniques, or new applications for existing systems. They also work to develop and build databases for remote sensing or geospatial; meaning relating to or denoting data that is associated with a particular location, project information. Remote sensing scientists also process aerial or satellite imagery to create products like land cover maps.
At the completion of the unit, students may be given the assignment of preparing a brief to an international organization in which they must address this statement:
Roughly 28 percent of Earth’s surface and over half of its population are directly affected by volcanism. Volcanism has wide effects on world rainfall, temperature, and other atmospheric conditions. Summarize the potential effects of volcanism on the world population based on the material studied in this module. Suggest ways humans can prepare for and adapt to this dynamic aspect of Earth’s physical system.
- Standalone Lesson (no technology required)