Lesson Plans
Lava Layering: Making and Mapping a Volcano
Overview
Students create a model or a volcano, produce and record lava flows, interpret geologic history through volcano formation and excavation. They will also make a connection between the life cycle of a volcano, and see why these features exist on Earth and Mars. This is a lesson provided from NASA's Jet Propulsion Laboratory.
Materials Required
- 1 paper cup, 100 mL (4 oz. size) - cut down to a height of 2.5 cm
- 2 paper cups, 150-200 mL (6-8 oz size) - 1 for baking soda, 1 for vinegar
- Cardboard (or cookie sheet, box lid, etc.) approximately 45 cm2
- At least 3 colors (preferably 4-6) of play dough or soft clay, fist sized pieces (download the play dough recipe)
- Tape
- Plastic spoon
- Plastic knife
- Metric ruler
- 1-3 clear drinking straws - cut into thirds
- Baking soda (4-10 spoonfuls depending on the number of lava flows)
- Vinegar, 100-150 mL (4-6 oz.) depending on the number and size of flows
- Paper towels
- Colored pencils (preferable matching the colors of the play dough)
- 2 sheets of graph paper, 8.5 x 11 inches
- Student worksheet
- Plastic wrap (optional - used if activity is done over two days)
Procedure
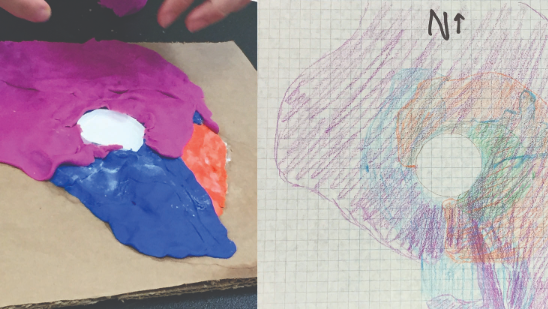
This classroom activity published by NASA Jet Propulsion Laboratory has students build and use a model of a volcano to investigate geologic history. Students use different colors of play dough to identify different lava flows over time. They record results while using the model. They then use the model to take a core sample and interpret their results. The full lesson can be found here.
Source:
- “Lava Layering: Making and Mapping a Volcano Activity | NASA/JPL Edu.” NASA, NASA, 14 Feb. 2017.
- “Lava Layering: Making and Mapping a Volcano” YouTube, YouTube, 11 Oct. 2018.
Disciplinary Core Ideas:
- ESS1C: The History of Planet Earth
- ESS2A: Earth Materials and Systems
Crosscutting Concepts:
- Structure and Function
Science and Engineering Practices:
- Developing and Using Models
The focus of this mini-lesson is on interpreting geologic history through volcano formation and excavation. Baking soda, vinegar, and play dough are used to model fluid lava flows. Various colors of play dough identify different eruption events.
Students will:
- Construct a model of a volcano
- Produce lava flows
- Observe, draw, record, and interpret the history and stratigraphy of a volcano produced by other students
- Make the connection between the life cycle of a volcano and why these features exist on Earth and Mars
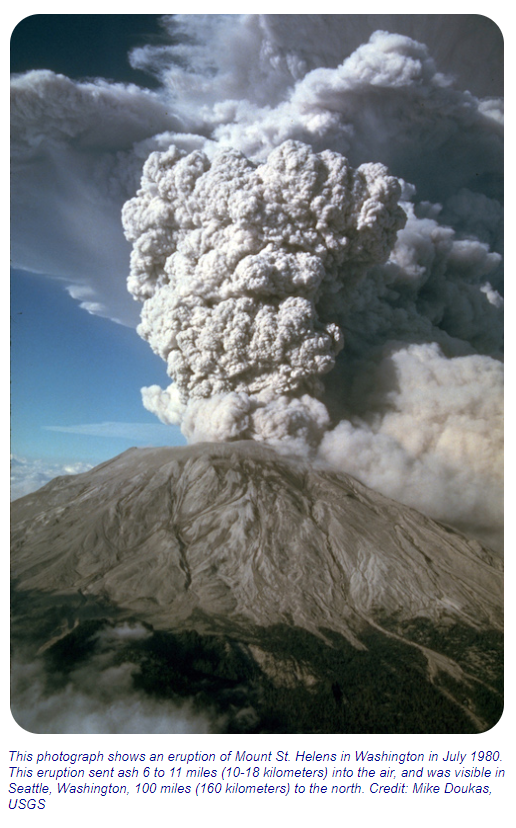
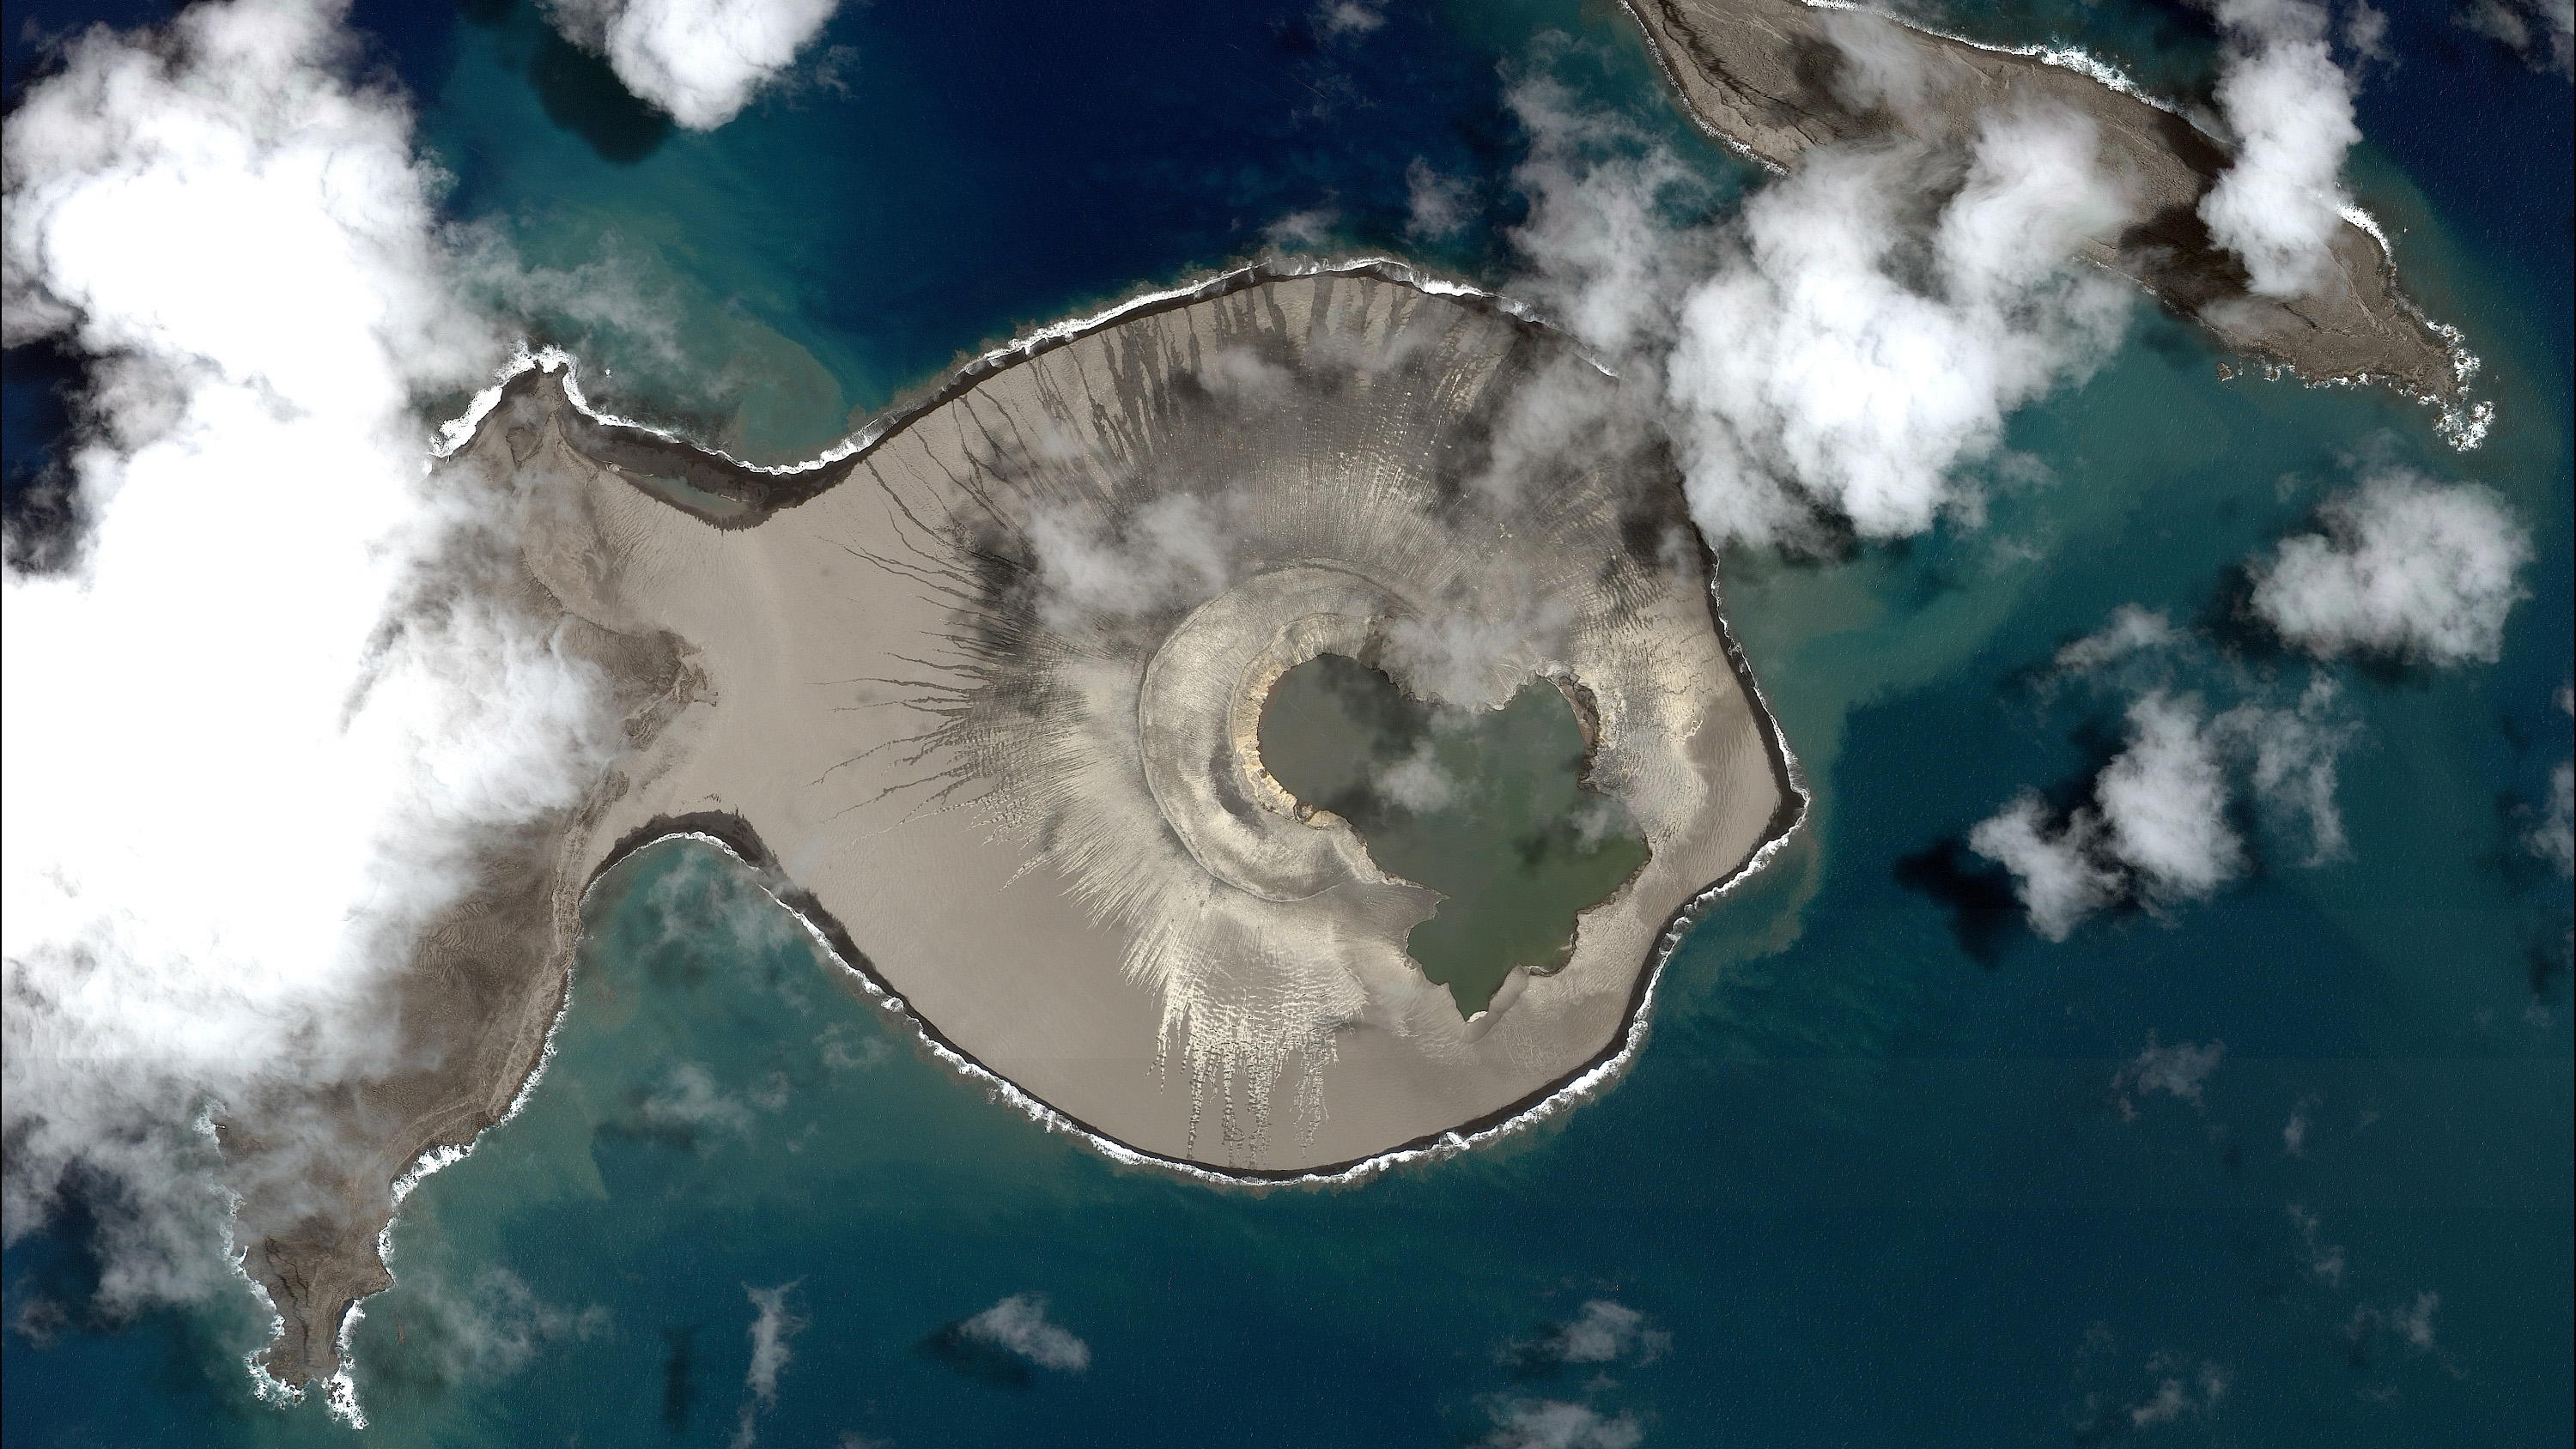
Volcanoes are windows into the interior of the Earth. Through subtle changes and dramatic explosions, they intrigue scientists and often strike fear into societies. Lava flows, pyroclastic flows, and lahars pose great risk to those living in the proximity of a volcano, while large explosive eruptions can affect the entire planet by filling the atmosphere with ash and sulfate particles thereby modify the global climate.
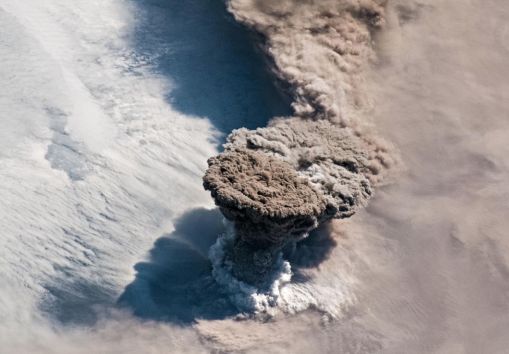
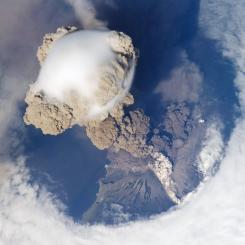
Explosive volcanic eruptions pose both short-term and long-term hazards. Lava flows and lahars can wipe out the flanks of mountainsides. Volcanic ash can blanket the landscape for miles, and ash clouds can disrupt aircraft travel, such as the incident in 1989 when ash from Alaska's Redoubt volcano temporarily disabled a passenger airplane. On longer time scales, eruptions can inject massive quantities of ash into the atmosphere, greatly reducing the solar heating of the Earth and potentially interrupting the global food supply for several years.
In 1991, Mount Pinatubo in the Philippines erupted, and strong winds spread the aerosol particles from the plume around the globe. The result was a measurable cooling of the Earth's surface for a period of almost two years. The role of natural hazards research and developing applications to mitigate the effects of disasters has global implications for reducing loss and saving lives.
The eruptive power and often long intervals of quiet dormancy of volcanoes make them both difficult to study, and difficult to live near. The threat of eruption is always there, but because eruptions are temporally episodic and distributed around the globe, we must rely on methods that give us observations of volcanic activity globally.
Evans, Diane, et al. “Solid Earth Science Working Group (SESWG).” NASA, NASA, 5 Feb. 2013, solidearth.jpl.nasa.gov/PAGES/volc01.html.
- Safety procedures
- All volcanoes are explosive.
- All mountains are volcanoes.
- Volcanic eruptions are chemical reactions.
- Mountains don’t move.
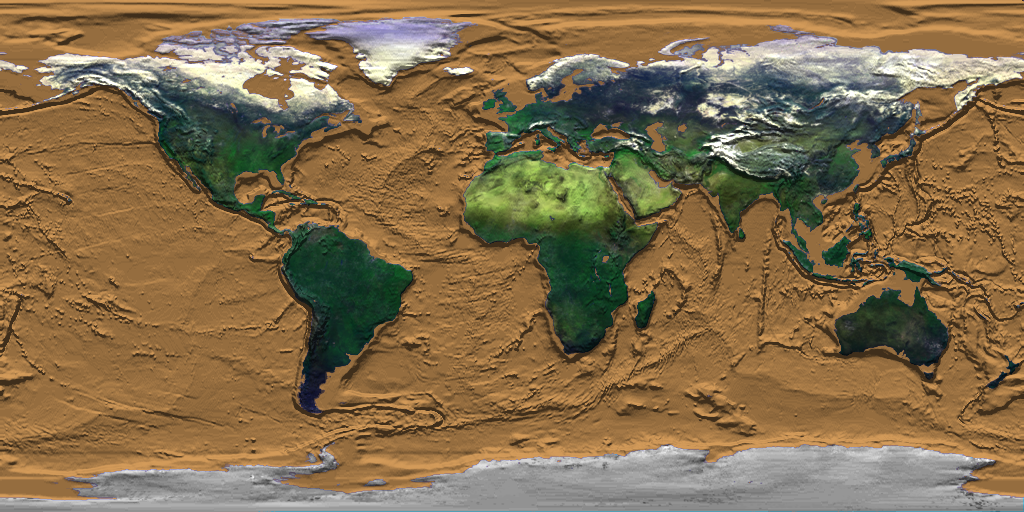
More than 1,500 potentially active volcanoes dot the Earth’s landscape, of which approximately 500 are active at any given time. Although scientists keep watch over many of the Earth’s volcanoes using traditional ground observation methods, satellite-based remote sensing is quickly becoming a crucial tool for understanding where, when, and why the Earth’s volcanoes periodically boil over.
Satellite technology now makes it possible to monitor volcanic activity in even the most isolated corners of the globe, and to routinely observe changes in the Earth’s surface that may signal an impending eruption. In addition, remote sensing data offer scientists the chance to prevent catastrophic damage to life and property by determining how and where volcanic debris spreads after an eruption.
The MODIS Thermal Alert System, known as MODVOLC, which now enables scientists to detect volcanic activity anywhere in the world within hours of its occurrence. MODVOLC uses data acquired by the Moderate Resolution Imaging Spectroradiometer (MODIS) sensors, which fly aboard NASA’s Terra and Aqua satellites. “The algorithm we’ve developed scans each 1-kilometer pixel within every MODIS image to see if it contains high-temperature heat sources, or hot spots. These heat sources may be active lava flows, lava domes, or lava lakes. Since MODIS achieves complete global coverage every 48 hours, this means that our system checks every square kilometer of the globe for volcanic activity once every two days,” said Dr. Robert Wright, a research scientist at the Hawaii Institute of Geophysics and Planetology (HIGP).
Although scientists will continue to use ground monitoring techniques to keep an eye on the Earth’s volcanoes, satellite data will increasingly allow scientists to see “the big picture” and, as a result, better predict volcanic activity.
Schmidt, Laurie J. “Sensing Remote Volcanoes | Earthdata.” NASA, NASA, 14 May 2019.
Geotechnical Engineer - A geotechnical engineer is a type of civil engineer who focuses on the mechanics of the land, rocks, and soils in the building process. This type of engineering includes, but is not limited to, analyzing, designing, and constructing foundations, retaining structures, slopes, embankments, roadways, tunnels, levees, wharves, landfills, and other systems that are comprised of rock or soil.
Data Visualizer - At the core of scientific visualization is the representation of data graphically - through images, animations, and videos - to improve understanding and develop insight. Data visualizers develop data-driven images, maps, and visualizations from information collected by Earth-observing satellites, airborne missions, and ground measurements. Visualizations allow us to explore data, phenomena and behavior; they are particularly effective for showing large scales of time and space, and "invisible" processes (e.g. flows of energy and matter) as integral parts of the models.
Remote Sensing Specialist - Remote sensing scientists use sensors to analyze data and solve regional, national and global concerns. For instance, natural resource management, urban planning, and climate and weather prediction are applications of remote sensing. Many scientists develop new sensor systems, analytical techniques, or new applications for existing systems. They also work to develop and build databases for remote sensing or geospatial; meaning relating to or denoting data that is associated with a particular location, project information. Remote sensing scientists also process aerial or satellite imagery to create products like land cover maps.
- Standalone Lesson (no technology required)